Decoding Disease Mechanisms: A Comprehensive Guide to ATAC-seq in Disease-Relevant Cell Types
This article provides a comprehensive guide for researchers and drug development professionals on applying ATAC-seq (Assay for Transposase-Accessible Chromatin with high-throughput sequencing) to disease-relevant cell types.
Decoding Disease Mechanisms: A Comprehensive Guide to ATAC-seq in Disease-Relevant Cell Types
Abstract
This article provides a comprehensive guide for researchers and drug development professionals on applying ATAC-seq (Assay for Transposase-Accessible Chromatin with high-throughput sequencing) to disease-relevant cell types. We explore the foundational principles of chromatin accessibility and its role in gene regulation within the context of specific pathologies. The guide details methodological workflows for primary cells, stem cell-derived models, and complex tissues, addressing key challenges in sample preparation and data generation. We present troubleshooting strategies for common pitfalls in low-input and challenging samples and discuss best practices for data validation, integration with multi-omics approaches, and comparative analysis against established methods like ChIP-seq and RNA-seq. This resource aims to empower precise epigenetic profiling to uncover novel therapeutic targets and biomarkers.
The Power of Open Chromatin: Why ATAC-seq is Essential for Disease Biology
Assay for Transposase-Accessible Chromatin using sequencing (ATAC-seq) is a pivotal technique in epigenomics that maps genome-wide chromatin accessibility. Within the context of a broader thesis on ATAC-seq in disease-relevant cell types, this protocol details its application for linking open chromatin regions to transcriptional regulatory mechanisms, crucial for identifying pathogenic drivers and therapeutic targets in complex diseases like cancer, autoimmune disorders, and neurodegeneration.
Key Principles and Quantitative Data
ATAC-seq utilizes a hyperactive Tn5 transposase to simultaneously fragment and tag accessible genomic DNA with sequencing adapters. These regions, nucleosome-depleted and often flanked by positioned nucleosomes, correlate with regulatory elements such as promoters, enhancers, and insulators.
Table 1: Key Quantitative Metrics in a Standard ATAC-seq Experiment
| Metric | Typical Target or Output | Significance |
|---|---|---|
| Cell Input | 50,000 - 100,000 viable cells (standard) | Balance between data complexity and avoiding over-sequencing. |
| Transposition Time | 30 minutes at 37°C | Critical for balanced insert size distribution. |
| PCR Amplification Cycles | 8-14 cycles (qPCR-guided) | Prevents over-amplification and library duplication. |
| Sequencing Depth | 50-100 million aligned reads per sample | Sufficient for saturation in human/mouse genomes. |
| Fraction of Reads in Peaks (FRiP) | >20-30% | Primary quality metric indicating signal-to-noise ratio. |
| Peak Distribution | ~50-100k peaks per mammalian sample | Accessible regions identified; varies by cell type. |
| Nucleosome-Free Fragment Length | <100 bp | Maps transcription factor binding sites. |
| Mononucleosomal Fragment Length | ~200 bp | Maps nucleosome positioning. |
Detailed Protocol: ATAC-seq in Disease-Relevant Primary Cells
A. Cell Preparation and Lysis
- Isolate target primary cells (e.g., patient-derived PBMCs, tumor infiltrating lymphocytes, neuronal progenitors). Ensure high viability (>90%) via Trypan Blue exclusion.
- Count cells. Centrifuge 50,000-100,000 cells at 500 x g for 5 min at 4°C. Aspirate supernatant fully.
- Lyse cells in 50 µL of chilled lysis buffer (10 mM Tris-HCl pH 7.4, 10 mM NaCl, 3 mM MgCl2, 0.1% IGEPAL CA-630). Invert tube 3 times to mix. Incubate on ice for 3 minutes.
- Immediately add 1 mL of chilled Nuclei Wash Buffer (10 mM Tris-HCl pH 7.4, 10 mM NaCl, 3 mM MgCl2) and invert to mix.
- Pellet nuclei at 500 x g for 10 min at 4°C. Carefully aspirate supernatant. Keep pellet on ice.
B. Transposition Reaction
- Prepare the Transposition Mix per sample: 25 µL 2x TD Buffer, 2.5 µL Tn5 Transposase (Illumina Tagment Enzyme, 100 nM final), and 22.5 µL nuclease-free water.
- Resuspend the washed nuclei pellet in 50 µL of the Transposition Mix by gentle pipetting. Do not vortex.
- Incubate at 37°C for 30 minutes in a thermal mixer with shaking at 300 rpm.
- Immediately purify DNA using a MinElute PCR Purification Kit (Qiagen). Elute in 21 µL Elution Buffer (10 mM Tris-HCl, pH 8.0).
C. Library Amplification and Clean-up
- To the 21 µL eluate, add 2.5 µL of a 25 µM custom Primer Ad1, 2.5 µL of a 25 µM barcoded Primer Ad2, and 25 µL of NEBNext High-Fidelity 2x PCR Master Mix.
- Amplify using the following thermocycler program:
- 72°C for 5 min (gap filling)
- 98°C for 30 sec
- Cycle 5-14 times: 98°C for 10 sec, 63°C for 30 sec, 72°C for 1 min.
- Hold at 4°C.
- Note: Determine optimal cycle number using a 5 µL qPCR side reaction.
- Purify the final library using a 1.8x ratio of AMPure XP beads. Elute in 20 µL Tris-HCl (10 mM, pH 8.0).
- Assess library quality and fragment distribution using a Bioanalyzer High Sensitivity DNA chip (expected periodical peaks <100 bp, ~200 bp, ~400 bp).
Data Analysis & Integration for Disease Mechanisms
Following sequencing, standard analysis involves:
- Alignment: Map reads to reference genome (e.g., hg38) using aligners like BWA or Bowtie2.
- Peak Calling: Identify reproducible accessible regions using MACS2 or Genrich.
- Differential Analysis: Compare peaks across conditions (e.g., diseased vs. healthy) with tools like DESeq2 or edgeR.
- Integration: Overlap ATAC-seq peaks with disease-associated SNPs from GWAS (e.g., via FUMA) and with RNA-seq data from matched samples to link regulatory changes to transcriptional outcomes.
Visualizations
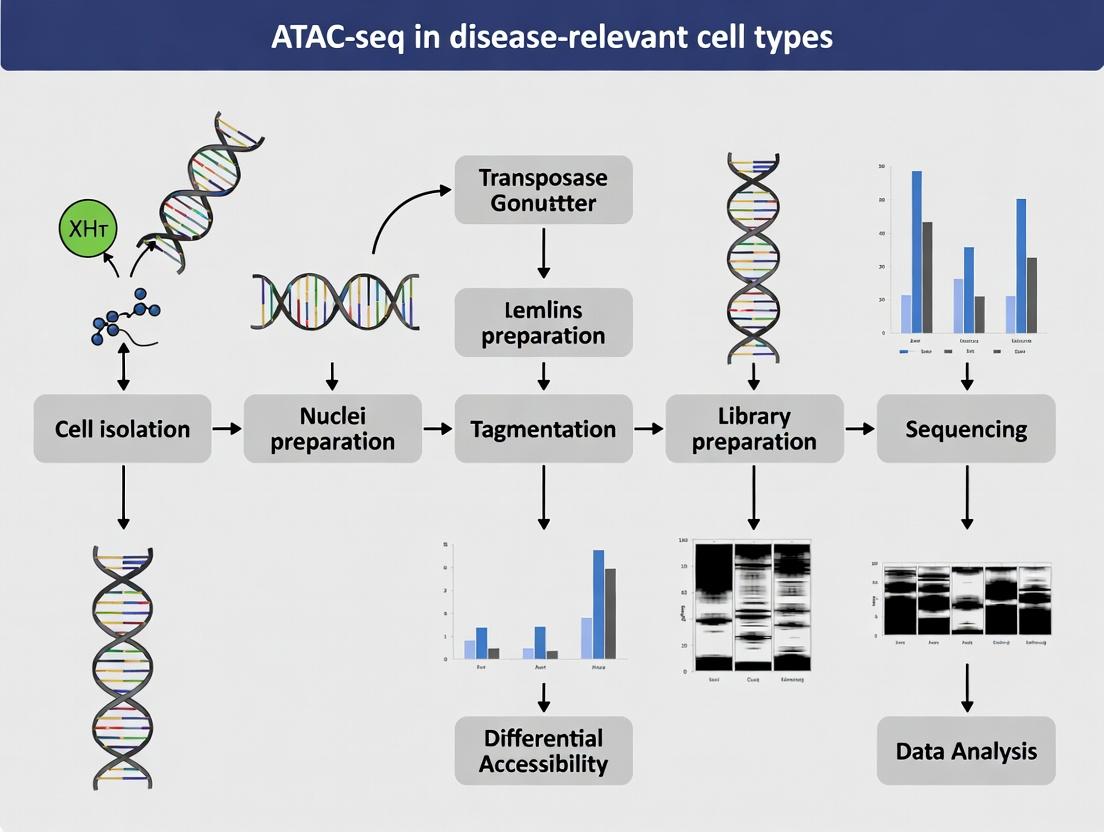
Title: ATAC-seq Experimental Workflow for Disease Research
Title: Linking ATAC-seq Peaks to Gene Regulation & Disease
The Scientist's Toolkit: Key Research Reagent Solutions
Table 2: Essential Materials for ATAC-seq in Primary Cells
| Item / Reagent | Function & Importance in Protocol |
|---|---|
| Viable Single-Cell Suspension | Starting material. High viability (>90%) is critical to prevent background from dead cells. |
| Hyperactive Tn5 Transposase | Core enzyme. Simultaneously cleaves and ligates adapters to accessible DNA. Commercial kits (Illumina) ensure reproducibility. |
| Nuclei Wash & Lysis Buffers | Isolate intact nuclei while removing cytoplasmic components that can inhibit transposition. |
| AMPure XP Beads | For size selection and clean-up post-PCR. A 1.8x ratio effectively removes short primer dimers and selects for proper library fragments. |
| NEBNext High-Fidelity 2x PCR Master Mix | Robust amplification with high fidelity and minimal bias during limited-cycle library PCR. |
| Bioanalyzer/TapeStation | Essential QC for assessing final library fragment size distribution (clear sub-nucleosomal periodicity). |
| Dual-Indexed PCR Primers | Enable multiplexing of samples. Unique barcodes for each sample are added during the PCR step. |
| Cell Strainer (40 µm) | For generating a single-nuclei suspension after lysis, preventing clogs in downstream steps. |
1. Introduction & Context within ATAC-seq Research
The central thesis of modern functional genomics in disease research posits that understanding the cell-type-specific regulatory landscape is paramount. ATAC-seq (Assay for Transposase-Accessible Chromatin using sequencing) has emerged as a cornerstone technology for this pursuit, enabling the mapping of open chromatin regions and transcription factor binding sites. The utility of ATAC-seq data, however, is fundamentally dependent on the biological relevance of the input cells. This document outlines the definition, sourcing, and validation of "disease-relevant cell types," bridging primary tissue analysis and engineered iPSC-derived models, with a focus on applications for ATAC-seq profiling.
2. Defining "Disease-Relevant Cell Type"
A "disease-relevant cell type" is defined by a combination of criteria, as summarized in the table below.
Table 1: Criteria for Defining a Disease-Relevant Cell Type
| Criterion | Description | Assessment Method |
|---|---|---|
| Genetic Evidence | The cell type harbors and expresses risk variants identified from Genome-Wide Association Studies (GWAS) or exhibits somatic mutations driving pathology. | Genetic sequencing, eQTL/pQTL colocalization, ATAC-seq variant overlap. |
| Pathological Presence | The cell type is present at the site of lesion, shows histological abnormalities, or is identified as a key component of diseased tissue. | Histopathology, immunohistochemistry, single-cell RNA-seq (scRNA-seq) on biopsies. |
| Functional Impact | Perturbation of the cell type's function (e.g., synaptic firing, cytokine secretion, contractility) recapitulates key phenotypic aspects of the disease. | Electrophysiology, cytokine assays, calcium imaging, metabolic flux analysis. |
| Regulatory Dynamism | The cell type exhibits significant, disease-associated changes in its chromatin accessibility landscape (ATAC-seq signal) and gene expression profile. | Differential ATAC-seq/RNA-seq analysis, transcription factor motif disruption analysis. |
3. Sourcing Disease-Relevant Cell Types: Pathways & Protocols
Diagram Title: Sourcing Pathways for Disease-Relevant Cells
3.1 Protocol A: Isolation of Nuclei for ATAC-seq from Primary Human Tissue (e.g., Post-Mortem Brain)
- Objective: To obtain high-quality, transcriptionally unaltered nuclei from frozen tissue for ATAC-seq, preserving in vivo chromatin states.
- Reagents: Dounce homogenizer, Nuclei EZ Lysis Buffer (Sigma, NUC101), Sucrose cushion buffer (0.32M Sucrose, 5mM CaCl2, 3mM MgAc, 0.1mM EDTA, 10mM Tris-HCl, pH7.5, 1mM DTT, 0.1% Triton X-100), 1x PBS + 0.04% BSA, Trypan Blue.
- Procedure:
- Tissue Homogenization: On ice, mince ~20-50 mg frozen tissue in 1 mL cold Lysis Buffer. Dounce 15-20 times with a loose pestle (A), then 10-15 times with a tight pestle (B).
- Nuclei Purification: Filter homogenate through a 40µm cell strainer. Layer filtrate over 1 mL of sucrose cushion buffer. Centrifuge at 1000xg for 10 min at 4°C.
- Wash & Resuspend: Carefully discard supernatant. Gently resuspend pellet in 1 mL PBS+0.04% BSA. Centrifuge at 500xg for 5 min at 4°C.
- Count & Quality Check: Resuspend in 50-100µL PBS+0.04% BSA. Count with Trypan Blue using a hemocytometer. Assess nuclei integrity (smooth, round) by microscopy. Proceed immediately to ATAC-seq tagmentation (using 50,000-100,000 nuclei per reaction).
3.2 Protocol B: Differentiation of iPSCs to Cortical Glutamatergic Neurons for Neurodevelopmental Disease Modeling
- Objective: Generate layer 2/3 cortical neuron precursors from human iPSCs for ATAC-seq analysis of neurodevelopmental disorder (e.g., ASD, epilepsy) regulatory landscapes.
- Reagents: Matrigel-coated plates, Small molecules (SMAD inhibitors: LDN193189, SB431542; Wnt inhibitor: IWR-1-endo), Neuronal maturation medium (Neurobasal, B-27, BDNF, GDNF, cAMP).
- Procedure (Adapted from dual-SMAD inhibition/Wnt modulation protocols):
- Neural Induction: Dissociate iPSCs to single cells and plate at high density in mTeSR Plus with 10µM Y-27632 (Day -1). At ~90% confluence (Day 0), switch to neural induction medium (NIM: DMEM/F12, N2, Non-Essential Amino Acids) containing 100nM LDN193189 and 10µM SB431542. Change media daily for 7 days.
- Cortical Patterning: On Day 7, dissociate neural rosettes and re-plate as aggregates in NIM + 2µM IWR-1-endo to promote forebrain fate. Culture for 7 days, media change every other day.
- Terminal Differentiation: On Day 14, plate aggregates on poly-ornithine/laminin-coated plates in neuronal maturation medium. Feed twice weekly for 4+ weeks. Neuronal identity (MAP2+, TBR1+, CTIP2+) and functionality should be validated before ATAC-seq at Day 45-60.
4. The Scientist's Toolkit: Key Research Reagent Solutions
Table 2: Essential Reagents for Defining & Profiling Disease-Relevant Cells
| Reagent/Material | Function | Example/Catalog Consideration |
|---|---|---|
| Chromium Next GEM Single Cell ATAC Kit (10x Genomics) | Enables high-throughput single-nucleus ATAC-seq (snATAC-seq) from complex cell populations, linking chromatin accessibility to cell identity. | 10x Genomics, 1000175 |
| Tn5 Transposase (Tagmentase) | The core enzyme for ATAC-seq, simultaneously fragments and tags accessible chromatin with sequencing adapters. | Illumina (20034197), or homemade Tn5. |
| Nuclei Isolation & Sorting Buffers | Preserve nuclear integrity and chromatin state during isolation from difficult tissues (e.g., brain, heart). | Nuclei EZ Lysis Buffer (Sigma), Nuclei PURE Prep Kit (Sigma). |
| Cell-Type-Specific Surface Antibody Panels (for FACS/MACS) | Isolate pure populations of target cells from primary tissue or differentiated cultures based on surface markers. | CD133, CD45, CD31, NCAM for neural/endothelial/immune cells. |
| Small Molecule Differentiation Kits | Robust, defined protocols for directing iPSCs to specific lineages (e.g., cardiomyocytes, dopaminergic neurons). | Gibco PSC Cardiomyocyte Differentiation Kit, STEMdiff Neural Kits. |
| CRISPR Activation/Interference (a/i) Libraries | Functionally validate the role of regulatory elements identified by ATAC-seq in disease-relevant cell phenotypes. | SAM (Synergistic Activation Mediator) or CRISPRi sgRNA libraries. |
| Cell Painting Dyes | Multiplexed, high-content imaging to assess morphological changes in disease-relevant cells upon genetic or compound perturbation. | MitoTracker, Concanavalin A, Hoechst, Phalloidin, etc. |
5. Validation & Integration Workflow
Diagram Title: Multi-Omic Validation Workflow
6. Key Quantitative Data Summary
Table 3: Comparative Metrics: Primary vs. iPSC-Derived Models for ATAC-seq
| Parameter | Primary Tissue-Derived Cells | iPSC-Derived Cells | Implication for ATAC-seq |
|---|---|---|---|
| Chromatin State Fidelity | High (native in vivo state). | Variable; may retain epigenetic memory or exhibit fetal-like/immature states. | Primary tissue is gold standard for mature disease states. iPSCs require rigorous maturation validation. |
| Donor & Cohort Scalability | Limited by tissue availability, especially for rare diseases or specific brain regions. | High; unlimited expansion from a single donor, enabling isogenic control generation via CRISPR. | iPSCs enable large-scale, genetically matched case-control studies. |
| Throughput for Screening | Low. | High. Amenable to 96/384-well formats for compound or genetic screens. | iPSC models are superior for pharmaco-ATAC-seq (chromatin profiling after drug treatment). |
| Average Nuclei Yield per 50mg Tissue/10^6 iPSCs | 0.5 - 2 x 10^6 nuclei (highly tissue-dependent). | 1 - 5 x 10^6 nuclei from a confluent 6-well of differentiated cells. | Yield impacts snATAC-seq feasibility. iPSCs provide more consistent starting material. |
| Key Technical Challenge | Cellular heterogeneity; post-mortem artifacts (for brain); need for rapid processing. | Differentiation efficiency and batch-to-batch variability; immature chromatin landscapes. | Protocols must include stringent QC (e.g., ENCODE metrics for ATAC-seq fragment size distribution). |
Application Notes
This application note details the use of Assay for Transposase-Accessible Chromatin with high-throughput sequencing (ATAC-seq) within a broader research thesis investigating disease-relevant cell types. By mapping genome-wide chromatin accessibility landscapes, ATAC-seq provides critical insights into the gene regulatory networks underpinning complex disease pathogenesis. The following sections summarize key findings and quantitative data from recent studies.
Table 1: ATAC-seq Insights Across Disease Applications
| Disease Area | Cell Type / Model | Key Chromatin Accessibility Findings | Linked Pathways/Genes | Therapeutic Implication |
|---|---|---|---|---|
| Neurodegeneration (Alzheimer's) | Human post-mortem microglia | Increased accessibility at APOE locus and endo-lysosomal genes in disease-associated microglia. | APOE, TREM2, CTSB | Highlights innate immune dysfunction; suggests targets for modulating microglial state. |
| Cancer (Acute Myeloid Leukemia) | Primary patient AML blasts | Distinct accessibility profiles predict survival; chemotherapy-resistant cells show accessible sites at stemness genes. | RUNX1, MYC enhancers, HOX clusters | Defines regulatory subtypes for prognosis and reveals drug-resistant regulatory circuits. |
| Autoimmunity (Rheumatoid Arthritis) | Synovial tissue fibroblasts (STFs) | Disease-specific STF subsets defined by open chromatin at pathogen response and matrix remodeling genes. | STAT3, IRF1, MMP genes | Identifies pathogenic fibroblast subsets for targeted ablation or reprogramming. |
| Neurodegeneration (Parkinson's) | iPSC-derived dopaminergic neurons with LRRK2 G2019S mutation | Hyper-accessibility at genes involved in synaptic function and lysosomal autophagy. | GBA, SNCA regulatory regions | Connects genetic risk to dysregulated transcriptional programs in vulnerable neurons. |
| Autoimmunity (SLE) | Human CD4+ T cells | Global increase in chromatin accessibility, particularly at interferon-response genes and activation loci. | IFIT cluster, CD69, CD40LG | Correlates with cell hyperactivation, suggesting epigenetic drivers of autoimmunity. |
Experimental Protocols
Protocol 1: ATAC-seq on Primary Human Immune Cells from Blood (e.g., SLE T cells) Reagents: See "The Scientist's Toolkit" below.
- Cell Preparation: Isolate PBMCs from fresh blood using density gradient centrifugation. Isolate target CD4+ T cells using magnetic-activated cell sorting (MACS). Count and assess viability (>95% required).
- Cell Lysis & Transposition: Pellet 50,000-100,000 cells. Resuspend in 50 µL of cold lysis buffer (10 mM Tris-HCl pH 7.4, 10 mM NaCl, 3 mM MgCl2, 0.1% IGEPAL CA-630). Incubate on ice for 3 minutes. Immediately add 50 µL of transposition mix (25 µL 2x TD Buffer, 2.5 µL Tn5 Transposase, 22.5 µL nuclease-free water). Mix gently and incubate at 37°C for 30 minutes in a thermomixer.
- DNA Clean-up: Purify transposed DNA using a MinElute PCR Purification Kit. Elute in 21 µL of Elution Buffer.
- Library Amplification: Amplify the purified DNA using Nextera indexing primers and a high-fidelity PCR master mix. Determine optimal cycle number via a 5-cycle qPCR side reaction to avoid over-amplification. Run the main PCR for the determined cycles.
- Library Purification & QC: Clean the amplified library using SPRI beads. Assess library quality and fragment distribution using a High Sensitivity DNA Kit on a Bioanalyzer or TapeStation. The ideal profile should show a periodicity of ~200 bp nucleosomal fragments.
- Sequencing: Pool libraries and sequence on an Illumina platform (e.g., NovaSeq) using paired-end sequencing (2x50 bp or 2x75 bp recommended).
Protocol 2: ATAC-seq on Frozen Tissue Sections (e.g., Rheumatoid Arthritis Synovium) Reagents: See "The Scientist's Toolkit" below.
- Nuclei Isolation from Tissue: Cryopreserved tissue section (20-30 mg) is placed in a Dounce homogenizer on ice. Add 1-2 mL of chilled Nuclei EZ Lysis Buffer. Dounce with loose pestle (15 strokes) followed by tight pestle (15 strokes). Filter the homogenate through a 40 µm cell strainer. Pellet nuclei at 500 x g for 5 min at 4°C.
- Nuclei Staining & Sorting (Optional): Resuspend nuclei in PBS with 1% BSA and DAPI (1 µg/mL). FACS-sort a specific population (e.g., DAPI-positive, tdTomato-positive for a lineage-labeled mouse model) or collect all nuclei. Collect 50,000 nuclei.
- Tagmentation & Downstream Processing: Pellet the sorted nuclei. Perform the transposition reaction directly on the nuclei pellet as described in Protocol 1, Step 2, but scale the reaction volume to nuclei count. Proceed with DNA purification, library amplification, and sequencing as in Protocol 1, Steps 3-6.
Visualizations
Title: ATAC-seq Links Genetic Risk to Microglial Dysfunction in Neurodegeneration
Title: ATAC-seq Workflow for Disease Research
Title: ATAC-seq Uncovers Epigenetic Basis of Therapy Resistance
The Scientist's Toolkit
| Research Reagent / Material | Function in ATAC-seq Protocol |
|---|---|
| Tn5 Transposase (Illumina or homemade) | Enzyme that simultaneously fragments accessible DNA and adds sequencing adapters. Core reagent. |
| Nuclei EZ Lysis Buffer (Sigma) or Hypotonic Lysis Buffer | For gentle isolation of intact nuclei from cells or frozen tissues, preserving chromatin state. |
| Magnetic Cell Separation (MACS) Kits (Miltenyi) | For rapid, high-purity isolation of specific cell types (e.g., CD4+ T cells) from heterogeneous samples. |
| SPRI (Solid Phase Reversible Immobilization) Beads (e.g., AMPure XP) | For size-selective purification and cleanup of DNA libraries, removing primers and small fragments. |
| Nextera Index Kit (Illumina) or compatible indexing primers | Adds unique dual indices (UDIs) to each library for multiplexing and sample identification during sequencing. |
| High Sensitivity DNA Analysis Kit (Agilent) | For accurate quality control and quantification of final ATAC-seq libraries prior to sequencing. |
| DAPI (4',6-diamidino-2-phenylindole) | DNA stain used for quantifying nuclei and for gating during Fluorescence-Activated Nuclei Sorting (FANS). |
ATAC-seq (Assay for Transposase-Accessible Chromatin using sequencing) has become a cornerstone technique for profiling chromatin accessibility in disease-relevant cell types. Within the broader thesis of applying ATAC-seq to understand disease mechanisms and identify therapeutic targets, a critical step is the functional interpretation of identified peaks. This involves deciphering transcription factor (TF) binding motifs, annotating enhancers, and reconstructing cell-type-specific gene regulatory networks (GRNs). These analyses bridge the gap between open chromatin regions and the dysregulated transcriptional programs underlying diseases like cancer, autoimmune disorders, and neurodegeneration.
Key Analytical Workflows and Protocols
Protocol: From ATAC-seq Peaks to TF Motif Enrichment
Objective: Identify transcription factors whose binding motifs are statistically overrepresented in a set of ATAC-seq peaks (e.g., differential peaks between diseased vs. healthy cells).
Detailed Methodology:
- Peak Set Preparation: Generate a BED file of peak genomic coordinates (e.g., using MACS2). For differential analysis, use tools like
DESeq2on peak counts. - Background Selection: Define a matched background set of genomic regions (e.g., using the
matchMotifsfunction inmonaLisaor randomized genomic regions with similar GC content and length). - Motif Scanning: Use a position weight matrix (PWM) database (e.g., JASPAR, CIS-BP) to scan for motif occurrences. Recommended tools:
HOMER(findMotifsGenome.pl),MEME-ChIP, ormonaLisain R.- HOMER Command Example:
- HOMER Command Example:
- Statistical Testing: Calculate enrichment p-values (hypergeometric, binomial tests) and correct for multiple testing (Benjamini-Hochberg). Tools output ranked lists of motifs/TFs.
- Interpretation: Integrate with TF expression data (from RNA-seq) to prioritize TFs that are both expressed and have enriched accessible motifs.
Protocol: Enhancer Annotation and Validation
Objective: Classify ATAC-seq peaks as putative enhancers and link them to target genes.
Detailed Methodology:
- Chromatin Signature Annotation: Intersect peaks with histone modification ChIP-seq data (e.g., H3K27ac for active enhancers, H3K4me1). Use
bedtools intersect. - Proximity-based Linking: Assign peaks to the promoter of the nearest transcription start site (TSS) within a defined window (e.g., 500 kb). Caution: This is simplistic.
- Chromatin Conformation-based Linking: Integrate with Hi-C or promoter capture Hi-C data to physically link enhancers to target genes via chromatin loops.
- Activity Validation (Experimental Follow-up):
- Cloning and Reporter Assay: Clone the genomic region of the peak into a luciferase vector (e.g., pGL4.23) upstream of a minimal promoter.
- Transfection: Transfer the construct into a relevant cell line.
- Measurement: Quantify luciferase activity relative to a control. A significant increase confirms enhancer activity.
- CRISPR-based Interruption: Use CRISPRi (dCas9-KRAB) to repress the enhancer region in situ and measure expression changes of the putative target gene via qRT-PCR.
Protocol: Constructing a Regulatory Network
Objective: Integrate ATAC-seq, RNA-seq, and TF motif data to infer a causal regulatory network.
Detailed Methodology:
- Data Integration Matrix:
- Regulator Activity Matrix: From ATAC-seq, create a matrix (rows: peaks, columns: samples) of peak accessibility Z-scores.
- TF-Peak Binding Matrix: A binary matrix indicating which peaks contain a motif for which TF (from Section 2.1).
- Target Expression Matrix: From RNA-seq, create a matrix of gene expression Z-scores for all TFs and candidate target genes.
- Network Inference: Use tools that combine motif information with correlation of accessibility/expression.
- SCENIC+ Protocol: The state-of-the-art for single-cell data, adaptable to bulk.
- Step A - TF-motif enrichment: Run
pycisTopicorHOMERto get TF-region associations. - Step B - Prune modules: Calculate correlation between TF expression and region accessibility; keep only regions where accessibility correlates with TF expression.
- Step C - Target gene prediction: Link pruned regions to genes (via proximity or chromatin contacts).
- Step D - Score network activity: Use AUCell to score the regulon (TF + target genes) activity per sample.
- Step A - TF-motif enrichment: Run
- SCENIC+ Protocol: The state-of-the-art for single-cell data, adaptable to bulk.
- Downstream Analysis: Identify master regulator TFs driving disease states. Perform network topology analysis (degree, betweenness centrality) to find key regulatory nodes.
Data Presentation
Table 1: Comparison of Major TF Motif Discovery Tools for ATAC-seq Data
| Tool | Algorithm Core | Key Input | Primary Output | Strengths for ATAC-seq | Reference |
|---|---|---|---|---|---|
| HOMER | Hypergeometric enrichment | Peak BED file, genome | List of enriched motifs/TFs, HTML report | Fast, user-friendly, integrated genome tools | Heinz et al., 2010 |
| MEME-ChIP | Multiple EM for Motif Elicitation | Peak sequences (FASTA) | De novo and known motif discovery | Excellent for de novo motif finding | Machanick & Bailey, 2011 |
| monaLisa (R/Bioc.) | Binomial enrichment with selection bias correction | Peak/background sets, BSgenome | R object of motif enrichments & plots | Robust background modeling, integrative R workflow | Machlab et al., 2022 |
| pycisTopic (Python) | Topic modeling on peak-cell matrix | Count matrix (single-cell) | Probabilistic TF-region assignments | Ideal for scATAC-seq, models co-accessibility | Bravo González-Blas et al., 2023 |
Table 2: Quantitative Metrics for Enhancer-Promoter Linking Methods
| Linking Method | Typical Resolution / Range | Required Assay Integration | Validation Success Rate* (%) | Key Limitation |
|---|---|---|---|---|
| Nearest Gene | Single gene within ~500 kb | None | ~20-30 | High false positive/negative rate |
| Hi-C / Micro-C | 1-10 kb (Micro-C), 1-100 kb (Hi-C) | Hi-C, Micro-C | ~40-60 | Resource-intensive; static snapshot |
| Promoter Capture Hi-C | Promoter-focused, 1-100 kb | pcHi-C | ~50-70 | Targeted; may miss enhancer-enhancer links |
| eQTL Colocalization | Statistical association | Genotyping, RNA-seq | ~30-50 | Limited to polymorphic sites; population-based |
*Reported approximate rates for correctly linked enhancer-gene pairs validated by CRISPRi in literature reviews.
Visualizations
Diagram 1: Core workflow for interpreting ATAC-seq peaks.
Diagram 2: Enhancer annotation and validation protocol.
The Scientist's Toolkit: Research Reagent Solutions
Table 3: Essential Reagents and Kits for ATAC-seq and Downstream Functional Studies
| Item | Category | Function & Application | Example Product/Supplier |
|---|---|---|---|
| Tn5 Transposase | Core Assay Enzyme | Simultaneously fragments and tags accessible chromatin with sequencing adapters. Critical for library prep. | Illumina Tagment DNA TDE1, Diagenode Hyperactive Tn5 |
| Cell Permeabilization Reagent | Sample Prep | Gently lyses cell membrane while keeping nuclei intact for Tn5 entry. Essential for intact nuclei prep. | IGEPAL CA-630, Digitonin |
| Magnetic Beads for Size Selection | Library Cleanup | Selective binding of DNA fragments (e.g., SPRI beads) to isolate nucleosome-free fragments (<~120 bp) for library enrichment. | Beckman Coulter AMPure XP, SpeedBeads |
| Luciferase Reporter Vector | Validation | Backbone plasmid (e.g., pGL4.23) with minimal promoter to test enhancer activity of cloned ATAC-seq peaks. | Promega pGL4.23[luc2/minP] |
| dCas9-KRAB Expression System | Functional Validation | For CRISPR interference (CRISPRi). Targeted repression of enhancer peaks to test necessity for gene expression. | Addgene plasmid #110821 (dCas9-KRAB), Sigma TRCN dCas9-KRAB lentivirus |
| TF Antibody (Validated for CUT&RUN/Tag) | TF Binding Validation | Validate specific TF binding at motif-containing peaks using low-input ChIP alternatives. | Cell Signaling Technology, Abcam (CUT&RUN-validated) |
| High-Fidelity PCR Mix | Library Amplification | Amplify tagmented DNA with minimal bias for final ATAC-seq library. Critical for complex representation. | NEB Next Ultra II Q5, KAPA HiFi HotStart ReadyMix |
From Cell to Data: Best Practices for ATAC-seq in Challenging Disease Models
The successful application of ATAC-seq (Assay for Transposase-Accessible Chromatin using sequencing) to disease-relevant cell types hinges entirely on the quality and integrity of the starting biological material. This phase is arguably the most critical, as downstream data are only as reliable as the input samples. For a thesis focused on mapping chromatin accessibility in disease contexts—such as cancer, autoimmune disorders, or neurodegenerative diseases—the acquisition and preparation of samples like primary cells, tissue biopsies, and frozen specimens present unique challenges. Compromised nuclear integrity, excessive nuclease activity, or contamination with irrelevant cell types can obscure true chromatin landscape signals, leading to biologically misleading conclusions. This document provides current application notes and detailed protocols to navigate this complex initial stage, ensuring high-quality input for robust ATAC-seq library preparation and analysis.
Table 1: Sample Type Characteristics & Suitability for ATAC-seq
| Sample Type | Key Advantage | Primary Challenge for ATAC-seq | Recommended Max Post-Collection Delay (Viable Nuclei) | Minimum Recommended Cell/Nuclei Yield per ATAC-seq Reaction |
|---|---|---|---|---|
| Fresh Primary Cells (e.g., PBMCs, T-cells) | High viability, intact signaling states, minimal artifact. | Rapid chromatin remodeling ex vivo; requires immediate processing. | < 30 minutes for optimal chromatin state fidelity. | 50,000 viable cells. |
| Solid Tissue Biopsies (e.g., tumor core, liver biopsy) | Preserves native tissue architecture and cell-cell interactions. | Extreme cellular heterogeneity; requires effective dissociation & nuclei isolation. | Process immediately (<1 hr) for best results. Dissociation time varies. | 50,000 - 100,000 isolated nuclei. |
| Frozen Tissue Samples (Snap-frozen/OCT) | Enables biobank utilization; pauses biological activity at moment of freezing. | Ice crystal formation can damage nuclear membranes. Optimization of lysis is critical. | N/A (Fixed in time). Thawing must be controlled. | 20-30 mg tissue (yield ~10,000-50,000 nuclei). |
| Cryopreserved Cells | Allows batch experimentation; useful for rare patient samples. | Cryopreservation agents (DMSO) and freeze-thaw cycles can affect nuclear integrity. | Thaw and process immediately; do not culture post-thaw for ATAC-seq. | 100,000 cryovial-stored cells (expect ~50-70% recovery). |
Table 2: Impact of Sample Handling on ATAC-seq Data Quality (Recent Benchmarking Data)
| Handling Variable | Metric Affected | Optimal Range | Suboptimal Consequence |
|---|---|---|---|
| Nuclei Isolation Lysis Time | Fragment Size Distribution (Global) | 2-10 minutes (ice-cold) | Over-lysis: Excessive small fragments (<100bp). Under-lysis: Low yield, large inaccessible fragments. |
| Cell Viability at Processing | Percentage of Reads in Peaks (PCR) | >90% | Low viability (<70%): High background from apoptotic DNA, reduced PCR. |
| Transposase Reaction Scaling | Library Complexity | 50,000 nuclei in 50µL Tn5 reaction | Underloading (<5,000 nuclei): Duplicate reads increase. Overloading (>100,000): Reaction saturation, uneven tagmentation. |
| Post-Thaw Delay (Frozen Tissue) | Transcription Factor Footprint Signal | Process homogenate within 5 min of thaw | Delay >15 min: Loss of fine footprint resolution due to endogenous nuclease activity. |
Detailed Protocols
Protocol 3.1: Nuclei Isolation from Fresh Solid Tissue Biopsies for ATAC-seq
Principle: Gentle mechanical disruption and osmotic lysis of the plasma membrane while keeping nuclear membranes intact, followed by purification to remove debris.
Materials:
- Fresh tissue biopsy (≤ 30 mg)
- Ice-cold PBS, 1% BSA
- Nuclei Extraction Buffer A: 10 mM Tris-HCl (pH 7.5), 10 mM NaCl, 3 mM MgCl2, 0.1% IGEPAL CA-630, 0.1% Tween-20, 0.01% Digitonin (freshly added), 1% BSA, 1x EDTA-free Protease Inhibitor.
- Nuclei Wash Buffer: 10 mM Tris-HCl (pH 7.5), 10 mM NaCl, 3 mM MgCl2, 0.1% Tween-20, 1% BSA.
- Dounce homogenizer (loose pestle, 2mL) or pre-chilled disposable pellet pestles.
- Flow cytometry strainer (40µm).
- Refrigerated centrifuge.
Procedure:
- Tissue Transport: Place biopsy in ice-cold PBS + 1% BSA. Process within 30 minutes of resection.
- Mince: Transfer tissue to a petri dish on ice. Mince finely with a sterile scalpel.
- Homogenize: Transfer minced tissue to a Dounce homogenizer containing 1 mL of ice-cold Nuclei Extraction Buffer A. Dounce with the loose pestle (10-15 strokes). Avoid frothing.
- Incubate: Incubate the homogenate on ice for 5 minutes.
- Filter: Filter the lysate through a pre-wetted 40µm flow cytometry strainer into a low-binding microcentrifuge tube.
- Wash: Centrifuge filtered lysate at 500 x g for 5 minutes at 4°C. Carefully aspirate supernatant.
- Resuspend: Gently resuspend the pellet in 1 mL of ice-cold Nuclei Wash Buffer. Centrifuge again at 500 x g for 5 minutes at 4°C.
- Count & Quality Check: Resuspend nuclei in a small volume of Nuclei Wash Buffer. Count using a hemocytometer with Trypan Blue or a fluorescent nuclear dye (e.g., DAPI). Assess integrity under a microscope. Proceed to tagmentation immediately or freeze nuclei pellet (see Protocol 3.3).
Protocol 3.2: Processing of Cryopreserved PBMCs for ATAC-seq
Principle: Rapid thawing to minimize DMSO toxicity, followed by gentle removal of dead cells and erythrocytes prior to nuclei isolation.
Materials:
- Cryovial of PBMCs.
- Pre-warmed Complete Culture Medium (e.g., RPMI+10% FBS).
- Ice-cold PBS, 1% BSA.
- Room temperature PBS.
- ACK Lysing Buffer.
- Nuclei Extraction Buffer B (milder): 10 mM Tris-HCl (pH 7.5), 10 mM NaCl, 3 mM MgCl2, 0.1% IGEPAL CA-630, 1% BSA.
- Centrifuge.
Procedure:
- Rapid Thaw: Thaw cryovial in a 37°C water bath with gentle agitation until only a small ice crystal remains.
- Dilute: Immediately transfer cell suspension to a 15mL tube containing 10 mL of pre-warmed Complete Medium drop-wise to dilute DMSO.
- Wash: Centrifuge at 300 x g for 5 minutes at room temperature. Aspirate supernatant.
- Red Blood Cell Lysis (if needed): Resuspend pellet in 1 mL of room-temperature ACK Lysing Buffer. Incubate for 2 minutes. Quench with 10 mL of PBS+1% BSA. Centrifuge at 300 x g for 5 minutes at 4°C.
- Viability Wash: Resuspend cells in ice-cold PBS+1% BSA. Count and assess viability (should be >80%).
- Nuclei Isolation: Pellet required number of cells (e.g., 100,000). Resuspend pellet in 50 µL of ice-cold Nuclei Extraction Buffer B. Incubate on ice for 5 minutes.
- Quench & Wash: Add 1 mL of ice-cold Wash Buffer. Centrifuge at 500 x g for 5 minutes at 4°C. Resuspend in desired buffer for tagmentation. Do not culture cells post-thaw.
Protocol 3.3: Isolation of Nuclei from Snap-Frozen Tissue for ATAC-seq
Principle: Grind frozen tissue to a powder to prevent thawing, followed by homogenization in a strong, cold lysis buffer designed to inactivate nucleases and lyse damaged cells quickly.
Materials:
- Snap-frozen tissue chunk (10-30 mg), stored at -80°C.
- Liquid Nitrogen and pre-chilled mortar & pestle.
- Frozen Tissue Lysis Buffer: 10 mM Tris-HCl (pH 7.5), 10 mM NaCl, 3 mM MgCl2, 0.1% IGEPAL CA-630, 0.5% Tween-20, 0.01% Digitonin, 20% Glycerol, 1x Protease Inhibitor.
- Dounce homogenizer (loose pestle).
- Flow cytometry strainer (40µm).
Procedure:
- Pre-chill: Cool mortar and pestle by adding liquid nitrogen.
- Grind: Place frozen tissue chunk in mortar. Add liquid nitrogen and grind vigorously until a fine powder forms. Keep tissue frozen at all times.
- Transfer: Quickly transfer the frozen powder to a Dounce homogenizer containing 1 mL of ice-cold Frozen Tissue Lysis Buffer.
- Immediate Homogenization: Immediately begin douncing with the loose pestle (10-15 strokes). The buffer will thaw the tissue.
- Incubate: Incubate on ice for 5 minutes.
- Filter & Wash: Filter through a 40µm strainer. Wash nuclei by centrifuging at 500 x g for 5 min at 4°C in Nuclei Wash Buffer (see Protocol 3.1).
- Count: Resuspend and count nuclei. Proceed directly to tagmentation. Do not refreeze isolated nuclei unless using a specific nuclei freezing protocol (e.g., in glycerol-containing buffer).
Workflow & Pathway Diagrams
The Scientist's Toolkit
Table 3: Essential Research Reagent Solutions for Sample Prep
| Item | Function & Rationale | Key Consideration for ATAC-seq |
|---|---|---|
| Digitonin (low-permeability detergent) | Creates pores in the cholesterol-containing plasma membrane while leaving the nuclear membrane relatively intact. Crucial for accessing cytoplasmic components or for gentle nuclei isolation. | Concentration is critical (0.01-0.1%). Used in Nuclei Extraction Buffers. Test lot-to-lot variability. |
| IGEPAL CA-630 (NP-40 Alternative) | Non-ionic detergent for complete cell lysis when used at higher concentrations or for longer times. | Used in combination with Digitonin in a "Dual Detergent" strategy for robust nuclei isolation from tough tissues. |
| Tn5 Transposase (Loaded) | Engineered transposase that simultaneously fragments and tags accessible DNA with sequencing adapters. The core enzyme in ATAC-seq. | Commercial loaded Tn5 (Nextera) ensures consistency. Aliquot and avoid freeze-thaw cycles. Activity varies by batch. |
| Sucrose or Glycerol-Containing Buffers | Provide osmotic stability and protect nuclei during freezing and thawing. Reduce ice crystal formation. | Essential for freezing isolated nuclei pellets if not proceeding immediately. Glycerol (10-20%) is common in frozen tissue lysis buffers. |
| Dnase/Rnase-free BSA | Acts as a carrier protein, reducing non-specific adsorption of nuclei and Tn5 enzyme to tube walls. Stabilizes reaction components. | Use at 0.1-1% in wash and resuspension buffers. Significantly improves nuclei recovery and reproducibility. |
| EDTA-free Protease Inhibitor Cocktail | Inhibits endogenous proteases released during tissue disruption that could degrade Tn5 or nuclear proteins. | Must be EDTA-free. EDTA chelates Mg2+, which is an essential cofactor for Tn5 transposase activity. |
| DAPI (4',6-diamidino-2-phenylindole) or SYTOX Green/Blue | Fluorescent dyes that stain DNA. Used for counting and assessing the integrity of isolated nuclei via fluorescence microscopy or flow cytometry. | Allows distinction between intact nuclei (smooth, round, bright) and debris/clumped chromatin. |
| Magnetic Beads for Size Selection (e.g., SPRI beads) | Polyethylene glycol (PEG)-based purification to select DNA fragments within a desired size range post-tagmentation/PCR. | Critical for removing primer dimers and large fragments. Double-sided size selection (e.g., 0.5x / 1.5x ratios) is standard for ATAC-seq libraries. |
Application Notes
This document details optimized ATAC-seq (Assay for Transposase-Accessible Chromatin using sequencing) protocols tailored for low-input samples and sensitive cell types (e.g., primary patient-derived cells, rare immune populations, neuronal progenitors). These adaptations are critical for advancing research within the broader thesis of mapping chromatin accessibility dynamics in disease-relevant cell models to identify regulatory drivers of pathology and potential therapeutic targets.
The primary challenges with standard ATAC-seq in these contexts include excessive mitochondrial DNA reads, high background noise, and insufficient library complexity from limited starting material. The protocols below integrate current best practices to mitigate these issues, enabling robust chromatin profiling from as few as 500-5,000 cells.
Data Presentation
Table 1: Comparison of Optimized Low-Input ATAC-seq Protocols
| Protocol Variant | Recommended Cell Input | Key Modifications | Median Fragment Size (bp) | % Mitochondrial Reads | Unique Nuclear Fragments (Target) |
|---|---|---|---|---|---|
| Standard (Buenrostro et al.) | 50,000+ | Lysis with NP-40, standard tagmentation | ~200-600 | 20-50%+ | >50,000 |
| Omni-ATAC | 500 - 50,000 | Digitonin-based lysis, PBS wash optimization | ~100-300 | <20% | >25,000 (from 5k cells) |
| ATAC-seq with Carrier | 100 - 1,000 | Use of inert dsDNA or yeast carrier | ~150-400 | 10-30%* | >10,000 (from 500 cells) |
| Bulk-Enabled ATAC (BETA) | 100 - 10,000 | Combinatorial barcoding, pooled tagmentation | ~100-300 | <15% | Varies by multiplex level |
| Fluorescence-Activated Nuclei Sorting (FANS-ATAC) | Any (rare populations) | Fixation, antibody staining, nuclei sorting | ~150-500 | <10% | Dependent on sorted count |
*Mitochondrial read percentage is reduced proportionally with effective carrier use.
Experimental Protocols
1. Omni-ATAC Protocol for Sensitive Cell Types (5,000 – 50,000 cells) Rationale: Replaces NP-40 with digitonin for more controlled plasma membrane permeabilization, preserving nuclear membrane integrity and reducing mitochondrial content.
Detailed Methodology: A. Cell Preparation & Lysis: 1. Harvest cells, wash once with 1x PBS. 2. Centrifuge at 500 rcf for 5 min at 4°C. Aspirate supernatant completely. 3. Resuspend cell pellet in 50 µL of Cold ATAC-RSB Lysis Buffer (10 mM Tris-HCl pH 7.4, 10 mM NaCl, 3 mM MgCl2, 0.1% Digitonin, 0.1% Tween-20, 0.01% Digitonin). Vortex briefly. 4. Incubate on ice for 3-10 min (optimize per cell type). 5. Add 1 mL of Cold ATAC-RSB Wash Buffer (RSB with 0.1% Tween-20, no digitonin). Invert to mix. 6. Centrifuge at 500 rcf for 10 min at 4°C. Aspirant supernatant carefully.
B. Tagmentation: 1. Prepare tagmentation mix: 25 µL 2x TD Buffer, 2.5 µL TDE1 (Tn5 Transposase), 22.5 µL Nuclease-free water per sample. 2. Resuspend the nuclei pellet in the 50 µL tagmentation mix by pipetting gently. Do not vortex. 3. Incubate at 37°C for 30 min in a thermomixer with shaking (300 rpm). 4. Immediately add 50 µL of DNA Binding Buffer (from a MinElute PCR Purification Kit) and mix thoroughly.
C. DNA Purification & Library Amplification: 1. Purify tagmented DNA using the MinElute PCR Purification Kit. Elute in 21 µL Elution Buffer. 2. Amplify library using 2x KAPA HiFi HotStart ReadyMix and 1-12 cycles of PCR with indexed primers. 3. Perform a double-sided SPRI bead cleanup (0.5x and 1.5x ratios) to remove primer dimers and large fragments. 4. Quantify library using a Qubit fluorometer and profile on a Bioanalyzer/TapeStation.
2. Low-Input Protocol with dsDNA Carrier (100 – 1,000 cells) Rationale: Uses inert, heterologous dsDNA (e.g., Lambda Phage DNA) to stabilize Tn5 transposase activity and prevent surface adsorption during low-input reactions.
Detailed Methodology: A. Nuclei Preparation: Follow Omni-ATAC lysis and wash steps (A1-A6) above, scaling volumes proportionally if below 1,000 cells.
B. Carrier-Added Tagmentation: 1. Prepare tagmentation mix per sample: * 25 µL 2x TD Buffer * 2.5 µL TDE1 * 2.5 µL dsDNA Carrier (10 ng/µL Lambda DNA, sheared) * 19.5 µL Nuclease-free water 2. Resuspend the nuclei pellet in the 49.5 µL mix. Incubate at 37°C for 60 min (extended time). 3. Add 50 µL DNA Binding Buffer + 2 µL of 10% SDS to quench, mix thoroughly.
C. Library Build & Carrier Removal: 1. Purify with MinElute Kit. Elute in 21 µL. 2. Perform PCR amplification (as in Omni-ATAC C2) for 12-16 cycles. 3. Critical: To remove carrier DNA, add 5 µL of 25 µM biotinylated oligonucleotide complementary to Lambda DNA to the PCR product. Incubate at 65°C for 10 min, then 25°C for 5 min. 4. Add 50 µL of Streptavidin-coated magnetic beads, incubate 15 min. Retrieve supernatant containing the purified ATAC-seq library. 5. Perform a final 1.0x SPRI bead cleanup. QC as above.
Mandatory Visualizations
Diagram 1: Omni-ATAC Workflow for Sensitive Cells
Diagram 2: Low-Input ATAC with Carrier DNA & Removal
The Scientist's Toolkit: Research Reagent Solutions
Table 2: Essential Materials for Optimized Low-Input ATAC-seq
| Item | Function & Rationale | Example Product/Catalog |
|---|---|---|
| Digitonin | Selective permeabilization agent. Lyses plasma but not nuclear membranes, reducing mitochondrial contamination. | Millipore Sigma, D141 |
| Tn5 Transposase | Engineered hyperactive transposase. Simultaneously fragments and tags accessible chromatin. | Illumina Tagment DNA TDE1 / DIY purified. |
| SPRIselect Beads | Solid-phase reversible immobilization beads. Size-selective cleanup of DNA fragments; critical for removing primers and selecting optimal fragment sizes. | Beckman Coulter, B23318 |
| MinElute PCR Purification Kit | Silica-membrane columns. Efficient purification of tagmented DNA in small elution volumes (10-20 µL) to maximize concentration. | Qiagen, 28004 |
| KAPA HiFi HotStart ReadyMix | High-fidelity PCR enzyme. Robust amplification of low-input libraries with minimal bias and duplication. | Roche, KK2602 |
| dsDNA Carrier | Inert genomic DNA. Stabilizes enzymatic reactions at low nucleic acid concentrations, preventing Tn5 aggregation. | Thermo Fisher, SD0011 (Lambda DNA) |
| Biotinylated Oligonucleotides | Sequence-specific probes. Enables capture and removal of carrier DNA post-amplification, preventing its sequencing. | IDT, custom synthesis. |
| Nuclei Staining Dye (DAPI) | Fluorescent DNA dye. Enables fluorescence-activated nuclei sorting (FANS) for precise isolation of specific populations. | Thermo Fisher, D1306 |
| SDS (10%) | Ionic detergent. Rapidly denatures/quilches Tn5 transposase post-tagmentation to halt reaction. | Various suppliers. |
Single-Cell ATAC-seq (scATAC-seq) for Dissecting Cellular Heterogeneity in Disease
Application Notes
Single-Cell Assay for Transposase-Accessible Chromatin sequencing (scATAC-seq) has become an indispensable tool for deconstructing the epigenetic landscape of complex tissues at cellular resolution. Within the broader thesis of applying ATAC-seq to disease-relevant cell types, scATAC-seq enables the identification of distinct cell states, rare pathogenic subpopulations, and regulatory dynamics driving disease progression and therapy resistance. These insights are pivotal for identifying novel therapeutic targets and biomarkers. Key applications include:
- Mapping Disease-Specific Cell States: Identifying chromatin accessibility signatures unique to pathogenic cell types (e.g., tumor-infiltrating T cell exhaustion states, Alzheimer's-associated microglia).
- Reconstructing Differentiation Trajectories: Inferring pseudotemporal dynamics of cellular development and how these trajectories are rewired in disease.
- Linking Regulatory Variants to Cell Type: Connecting non-coding disease-associated genetic variants (GWAS loci) to cell-type-specific cis-regulatory elements (cCREs).
- Multiomic Integration: Correlating chromatin accessibility with transcriptomic (scRNA-seq) or surface protein (CITE-seq) data from the same cells to build unified models of gene regulation.
Protocol 1: Nuclei Isolation from Frozen Tissue for scATAC-seq
This protocol is optimized for recovering high-quality nuclei from frozen, disease-relevant human or mouse tissues (e.g., tumor biopsies, brain sections).
- Cryopreserved Tissue Grinding: Place 20-50 mg of frozen tissue in a pre-chilled Covaris cryoPREP Pulverizer tube. Impact until tissue is a fine powder. Keep samples submerged in liquid nitrogen.
- Nuclei Extraction: Quickly transfer powder to a Dounce homogenizer containing 2 mL of chilled Lysis Buffer (10 mM Tris-HCl pH 7.4, 10 mM NaCl, 3 mM MgCl2, 0.1% IGEPAL CA-630, 0.1% Tween-20, 0.01% Digitonin, 1% BSA). Homogenize with 10-15 strokes of the loose pestle (A), then 10-15 strokes of the tight pestle (B) on ice.
- Filtration & Washing: Filter homogenate through a 40 µm Flowmi cell strainer into a 15 mL tube. Add 1 mL of Wash Buffer (10 mM Tris-HCl pH 7.4, 10 mM NaCl, 3 mM MgCl2, 0.1% Tween-20, 1% BSA) to stop lysis.
- Centrifugation & Counting: Centrifuge at 500 rcf for 5 min at 4°C. Gently resuspend pellet in 1 mL Wash Buffer. Count nuclei using a fluorescent DNA stain (e.g., Trypan Blue with Acridine Orange) on a hemocytometer or automated counter. Adjust concentration to ~1,000 nuclei/µL.
Protocol 2: Library Preparation Using the 10x Genomics Chromium Platform
This standardized protocol details the use of a commercial droplet-based system for high-throughput scATAC-seq library construction.
- Tagmentation & Barcoding: Combine ~10,000 nuclei with ATAC Buffer and Tn5 Transposase from the Chromium Next GEM Single Cell ATAC Kit. Load the mixture, along with Gel Beads and partitioning oil, onto a Chromium Chip G. The instrument generates gel bead-in-emulsions (GEMs), where transposition and nuclei lysis occur, and each nucleus receives a unique barcode.
- Post-GEM Cleanup & Amplification: Break GEMs and pool barcoded DNA. Perform a SPRIselect bead clean-up. Amplify the library via PCR (12-14 cycles) using kit-specific primers.
- Library Construction: Perform a dual-sided SPRIselect size selection to isolate fragments primarily between 100-700 bp. Construct sequencing libraries via a second PCR (5-10 cycles) to add sample indices and full sequencing adapters.
- QC & Sequencing: Assess library quality using a Bioanalyzer (peak ~200-600 bp). Pool libraries and sequence on an Illumina platform. Target: 25,000 paired-end reads per nucleus (e.g., NovaSeq, PE50).
Data Presentation: Key Metrics from Representative Studies
Table 1: Example scATAC-seq Dataset Metrics from Disease Studies
| Study Focus | Tissue Source | Cells Passed QC | Median Fragments/Cell | TSS Enrichment Score | Key Finding |
|---|---|---|---|---|---|
| Colorectal Cancer | Human tumor & normal | 112,541 | 14,250 | 12.5 | Identified a metastasis-driving regulatory program in a rare tumor epithelial subpopulation. |
| Alzheimer's Disease | Human prefrontal cortex | 70,631 | 9,800 | 10.8 | Discovered a disease-associated microglia subtype with accessible sites near risk genes (e.g., APOE). |
| COVID-19 Severity | Human PBMCs | 156,940 | 11,400 | 13.2 | Found altered chromatin accessibility in monocytes correlating with hyperinflammatory state. |
| Autoimmune Arthritis | Mouse synovium | 22,167 | 18,500 | 15.0 | Mapped pathogenic fibroblast states and their specific transcription factor regulons. |
Mandatory Visualizations
Title: scATAC-seq Experimental Workflow from Tissue to Data
Title: scATAC-seq Computational Analysis Pipeline
The Scientist's Toolkit: Essential Research Reagents & Materials
Table 2: Key Reagent Solutions for scATAC-seq Experiments
| Item | Function/Benefit | Example Product/Brand |
|---|---|---|
| Chromium Next GEM Single Cell ATAC Kit | Integrated reagent kit for droplet-based partitioning, barcoding, and library prep. | 10x Genomics |
| CryoPREP Tissue Pulverizer | Mechanically pulverizes frozen tissue without thawing, preserving nuclear integrity. | Covaris |
| Digitonin | Mild detergent used in lysis buffers for precise nuclear membrane permeabilization. | MilliporeSigma |
| SPRIselect Beads | Solid-phase reversible immobilization beads for size selection and library clean-up. | Beckman Coulter |
| Nuclei Buffer (BSA-containing) | Stabilizes isolated nuclei, prevents aggregation, and maintains chromatin state. | 10x Genomics Nuclei Buffer |
| Validated Tn5 Transposase | Engineered transposase for simultaneous fragmentation and adapter tagging of open chromatin. | Illumina (Tagment DNA TDE1) |
| Dual Index Kit Set A | Provides unique combinatorial indices for multiplexing samples in a single sequencing run. | 10x Genomics Dual Index Kit |
| High-Sensitivity DNA Assay | Quality control for final library fragment size distribution and concentration. | Agilent Bioanalyzer/TapeStation |
Within the broader thesis on ATAC-seq in disease-relevant cell types, a critical limitation of single-assay studies is the incomplete view of gene regulation. Multiome approaches, which simultaneously profile chromatin accessibility (ATAC-seq) and gene expression (RNA-seq) from the same single cell, bridge this gap. This unified view is indispensable for linking non-coding regulatory element variants, discovered via ATAC-seq in diseased cells, to their target genes and downstream transcriptional consequences, directly informing mechanistic drug target discovery.
Core Principles & Current Data Landscape
Multiome assays (e.g., 10x Genomics Multiome ATAC + Gene Expression) generate paired, cell-specific chromatin accessibility and transcriptome data. Recent benchmarking studies provide key quantitative performance metrics.
Table 1: Performance Metrics of Single-Cell Multiome ATAC + RNA Sequencing
| Metric | Typical Output (10x Genomics Platform) | Implication for Disease Research |
|---|---|---|
| Cells Recovered | 5,000 - 10,000 per lane | Enables profiling of rare disease-relevant cell populations. |
| Median Genes per Cell (RNA) | 1,000 - 5,000 | Sufficient for robust cell type identification and state assessment. |
| Median Fragments per Cell (ATAC) | 5,000 - 25,000 | Enables identification of ~20,000-50,000 accessible peaks per sample. |
| Pairing Efficiency | 65% - 85% (fraction of cells with both modalities) | Ensures high-confidence cis-regulatory linkage for majority of cells. |
| Sequencing Saturation (RNA) | Recommended: 50,000-100,000 reads/cell | For accurate gene expression quantification. |
| Sequencing Depth (ATAC) | Recommended: 25,000-100,000 fragments/cell | For high-confidence peak calling and motif analysis. |
Detailed Protocol: Multiome ATAC + RNA Library Preparation from Primary Human T Cells
This protocol is adapted for disease-relevant primary human cells, such as activated T-cells from patient samples, using the 10x Genomics Chromium Next GEM Single Cell Multiome ATAC + Gene Expression kit.
Part A: Cell Preparation and Nuclei Isolation
Key Reagent Solutions:
- Restriction Enzyme Buffer (10x): Maintains optimal salt conditions for transposition.
- Nuclei Buffer: Contains detergents (e.g., IGEPAL) and stabilizing agents (BSA) for clean nuclear isolation while preserving RNA integrity.
- Transposase (Tn5) Loaded with Sequencing Adapters: Enzymatically cleaves accessible DNA and adds adapters in a single step ("tagmentation").
Procedure:
- Cell Viability & Count: Isolate primary human T-cells via negative selection. Assess viability (>90%) using a Trypan Blue or acridine orange/propidium iodide count. Target 10,000-20,000 living cells for recovery.
- Cell Lysis & Nuclei Isolation: Pellet 10,000 cells. Resuspend in 50 µL chilled, diluted Nuclei Buffer. Incubate on ice for 3 minutes. Quench reaction with 100 µL of wash buffer containing BSA.
- Nuclei Wash & Count: Pellet nuclei (500 rcf, 5 min, 4°C). Gently resuspend in 50 µL wash buffer. Count stained nuclei (e.g., with DAPI) on a hemocytometer. Adjust concentration to 1,000-4,000 nuclei/µL.
- Tagmentation: Combine 5 µL of nuclei suspension, 10 µL of Tagmentation Buffer, and 5 µL of Loaded Tn5 Transposase. Mix and incubate at 37°C for 60 minutes.
- Tagmentation Cleanup: Add 20 µL of provided cleanup buffer. Mix and incubate at 37°C for 15 min. Pellet nuclei, resuspend in 50 µL wash buffer.
Part B: GEM Generation & Library Construction
Key Reagent Solutions:
- Gel Beads: Contain barcoded oligonucleotides with primers for both cDNA synthesis (poly-dT) and ATAC fragment amplification (PCR handle).
- Partitioning Oil & Master Mix: Enables nanoliter-scale droplet formation for single-cell partitioning and reverse transcription/tagmentation amplification.
Procedure:
- Partitioning: Load the 50 µL nuclei, Master Mix, and Gel Beads into a Chromium chip. Run on the Chromium Controller to generate Gel Beads-in-Emulsion (GEMs).
- In-GEM Reactions: Incubate the GEMs to perform:
- Reverse Transcription: Generates barcoded, full-length cDNA from poly-adenylated RNA.
- ATAC Amplification: Amplifies barcoded transposed DNA fragments.
- Post-GEM Cleanup: Break emulsions. Recover barcoded cDNA and ATAC fragments using DynaBeads.
- Library Construction (Two Separate Libraries):
- Gene Expression Library: Amplify cDNA via PCR (12 cycles), then fragment, A-tail, and ligate sample indexes. Size select for ~400 bp inserts.
- ATAC Library: Amplify ATAC fragments via PCR (13 cycles) using dual-indexing primers. Size select for 300-600 bp fragments (mono-nucleosomal peak).
- QC & Sequencing: Assess libraries on Bioanalyzer (expected size distributions). Pool libraries and sequence on an Illumina platform:
- Gene Expression: Read 1: 28 bp (10x Barcode + UMI), Read 2: 90 bp (transcript), i7 Index: 10 bp, i5 Index: 10 bp.
- ATAC: Read 1: 50 bp (genomic insert), Read 2: 50 bp (genomic insert), i7 Index: 8 bp, i5 Index: 24 bp (10x Barcode + UMI).
Data Integration & Analysis Workflow
The power of Multiome lies in integrated bioinformatics analysis.
Diagram 1: Multiome Data Analysis Workflow (84 chars)
Application: Identifying Dysregulated Pathways in Disease
Integrated data reveals active regulatory programs. For example, in autoimmune disease T-cells, ATAC-seq may reveal novel accessibility at an enhancer near the IL23R locus. Multiome links this specifically to IL23R-expressing cell subsets, confirming its active state.
Diagram 2: From Regulatory Variant to Drug Target (65 chars)
The Scientist's Toolkit: Key Research Reagent Solutions
Table 2: Essential Reagents for Multiome Experiments in Disease Research
| Item | Function & Rationale | Example/Provider |
|---|---|---|
| Viability Stain | Distinguish live/dead cells prior to nuclei isolation. Critical for data quality from fragile primary patient cells. | Acridine Orange/Propidium Iodide, BioLegend |
| Nuclei Isolation Buffer | Lyses cytoplasmic membrane while preserving nuclear integrity and intranuclear RNA. | 10x Genomics Nuclei Buffer, CHAPS-based buffers |
| Barcoded Gel Beads | Provide unique cell barcode and UMIs for single-cell partitioning in GEMs. Core of the assay. | 10x Genomics Chromium Next GEM Chip |
| Loaded Tn5 Transposase | Engineered transposase pre-loaded with sequencing adapters for simultaneous fragmentation and tagging of accessible DNA. | 10x Genomics Multiome ATAC Enzyme |
| SPRIselect Beads | For size selection and cleanup of ATAC & RNA libraries. Preferable for consistent fragment size ranges. | Beckman Coulter SPRIselect |
| Dual Index Kit Sets | Provide unique combinatorial indexes for multiplexing samples, essential for cohort studies. | 10x Genomics Dual Index Kit TT, Set A |
| Nuclease-Free Water | Used in all reaction setups to prevent RNA degradation and enzymatic interference. | Invitrogen UltraPure DNase/RNase-Free Water |
| High-Fidelity PCR Mix | For minimal-bias amplification of low-input ATAC and cDNA libraries. | Kapa HiFi HotStart ReadyMix, NEB Next Ultra II |
Solving the Puzzle: Troubleshooting ATAC-seq in Complex Disease Samples
Within the broader thesis on utilizing ATAC-seq to map chromatin accessibility in disease-relevant cell types (e.g., patient-derived neurons, tumor-infiltrating lymphocytes, or cardiac fibroblasts), data quality is paramount. This Application Note addresses three critical technical pitfalls that can compromise the biological interpretation of epigenetic landscapes in pathological states. Low library complexity masks rare cell populations, high mitochondrial reads waste sequencing depth, and background noise obscures disease-specific regulatory elements, collectively hindering the discovery of novel therapeutic targets.
Table 1: Summary of Common Pitfall Metrics and Impacts
| Pitfall | Typical Metric Threshold | Impact on Data | Potential Consequence for Disease Research |
|---|---|---|---|
| Low Library Complexity | Non-Redundant Fraction (NRF) < 0.8 | Few unique fragments, high duplication rate. | Inability to detect rare, disease-driving cell states; false-negative regulatory element discovery. |
| High Mitochondrial Reads | >20% of total reads (varies by cell type) | Depletes sequencing budget from nuclear chromatin. | Reduced statistical power at key nuclear loci; skewed differential accessibility analysis. |
| Background Noise | High % of reads in low-count peaks (e.g., TSS enrichment < 10) | Diffuse, low-signal peaks outside true open chromatin. | High false-positive rate in identifying accessible regions; obscures subtle disease-associated shifts. |
Table 2: Recommended QC Metrics for ATAC-seq in Disease Models
| QC Metric | Optimal Range | Assessment Tool |
|---|---|---|
| Fraction of Mitochondrial Reads | < 20% (ideally < 10%) | SAMtools, Picard |
| Non-Redundant Fraction (NRF) | > 0.8 | ENCODE ATAC-seq pipeline |
| TSS Enrichment Score | > 10 | MACS2, ENCODE pipeline |
| Fraction of Reads in Peaks (FRiP) | > 0.2 (Cell type dependent) | MACS2, HOMER |
Experimental Protocols
Protocol 3.1: Mitigating Low Library Complexity
Principle: Ensure sufficient cell input and minimize DNA loss during tagmentation and purification.
- Cell Input: Start with 50,000-100,000 viable, nuclei for primary or rare disease-relevant cells. Count nuclei post-lysis with trypan blue.
- Tagmentation Optimization: Titrate Tn5 enzyme (e.g., 2.5 µL to 5 µL) for 30 min at 37°C. Quench with 2.5 µL of 0.2% SDS and incubate at 55°C for 15 min.
- Clean-up & Amplification: Purify tagmented DNA using a double-sided SPRI bead cleanup (0.5x and 1.5x ratios). Amplify library with 1/3rd of eluate using NEBNext High-Fidelity 2X PCR Master Mix for 10-12 cycles (determined via qPCR side reaction).
- Final Purification: Perform a final 1.2x SPRI bead size selection to remove primer dimers and large fragments. Quantify by Qubit and profile by Bioanalyzer/TapeStation.
Protocol 3.2: Reducing Mitochondrial Reads
Principle: Enrich for intact nuclei and deplete mitochondrial DNA.
- Gentle Nuclei Isolation: Lyse cells in ice-cold lysis buffer (10 mM Tris-HCl pH 7.4, 10 mM NaCl, 3 mM MgCl2, 0.1% IGEPAL CA-630) for 3-5 minutes on ice. Immediately dilute with wash buffer.
- Nuclei Purification: Pellet nuclei at 500 rcf for 5 min at 4°C. Resuspend gently in PBS + 0.1% BSA. Filter through a 30 µm pre-wetted strainer.
- (Optional) Mitochondrial Depletion: Add 1 µL of RNase A (10 mg/mL) to the tagmented DNA post-quench and incubate at 37°C for 15 min before cleanup to digest contaminating mitochondrial RNA.
- Nuclear Integrity Check: Stain an aliquot with DAPI and verify under a microscope; debris should be minimal.
Protocol 3.3: Minimizing Background Noise
Principle: Maximize signal-to-noise by removing dead cells and precise size selection.
- Viability & Debris Removal: Prior to lysis, stain cells with a viability dye (e.g., DRAQ7 or Propidium Iodide). Use fluorescence-activated cell sorting (FACS) to isolate single, viable nuclei.
- Targeted Fragment Selection: Post-amplification, perform a dual-SPRI bead size selection.
- Add 0.5x volumes of SPRI beads to the PCR product. Incubate 5 min, pellet, and KEEP SUPERNATANT (contains small fragments <100 bp).
- To the supernatant, add an additional 0.3x volumes of SPRI beads (total 0.8x). Incubate, pellet, and discard supernatant.
- Wash beads twice with 80% ethanol. Elute in TE buffer. This selects for the nucleosome-free (<100 bp) and mononucleosome (~200 bp) fragments, enriching for true open chromatin.
Visualization Diagrams
Diagram 1: ATAC-seq Pitfall Mitigation Workflow (98 chars)
Diagram 2: Optimized ATAC-seq Protocol for Disease Cells (94 chars)
The Scientist's Toolkit
Table 3: Key Research Reagent Solutions for Robust ATAC-seq
| Item | Function & Rationale |
|---|---|
| Tn5 Transposase (Custom-loaded) | Enzyme that simultaneously fragments and tags genomic DNA at open chromatin regions. Critical for library complexity. |
| IGEPAL CA-630 (or NP-40 Alternative) | Non-ionic detergent for gentle cytoplasmic membrane lysis while preserving nuclear integrity, reducing mitochondrial contamination. |
| SPRIselect Beads | Magnetic beads for size-based DNA purification. Enables precise selection of nucleosome-free (~<100 bp) and mononucleosomal (~200 bp) fragments. |
| DRAQ7 or Propidium Iodide | Membrane-impermeant DNA dyes for staining and Fluorescence-Activated Cell Sorting (FACS) of intact, viable nuclei, reducing background. |
| RNase A | Degrades RNA. Post-tagmentation treatment can remove mitochondrial RNA-templated reads, lowering %MT. |
| NEBNext High-Fidelity 2X PCR Master Mix | High-fidelity polymerase for limited-cycle amplification of libraries, minimizing PCR duplicates and bias. |
| Nuclei Counting Solution (Trypan Blue) | Allows accurate quantification of intact nuclei pre-tagmentation, ensuring optimal input for library complexity. |
Within the broader thesis of utilizing ATAC-seq to map chromatin accessibility in disease-relevant cell types, a major frontier is accessing archived clinical specimens. Formalin-fixed, paraffin-embedded (FFPE) tissues represent an immense, untapped reservoir of molecular data linked to long-term patient outcomes. Optimizing methods for these samples is critical to translate epigenetic insights from model systems to real human disease pathophysiology and accelerate biomarker and drug target discovery.
Recent advancements have enabled chromatin profiling from FFPE tissues, though with unique challenges and performance characteristics compared to fresh/frozen samples.
Table 1: Performance Metrics of FFPE-ATAC-seq vs. Standard ATAC-seq
| Metric | Standard ATAC-seq (Fresh/Frozen) | Optimized FFPE-ATAC-seq | Notes |
|---|---|---|---|
| Input Nuclei | 500 - 50,000 | 5,000 - 100,000 | Higher input often needed for FFPE due to damage. |
| Key QC Metric (TSS Enrichment) | 10 - 25+ | 4 - 15 | FFPE samples show reduced but usable signal. |
| Fragment Size Distribution | Clear nucleosomal periodicity | Attenuated periodicity | Crosslinking and fragmentation blur pattern. |
| Peak Yield | 50,000 - 150,000 | 15,000 - 80,000 | Dependent on fixation quality and age. |
| Data Usability | High-quality snATAC-seq possible | Primarily bulk, emerging snATAC-seq | Single-nucleus from FFPE is cutting-edge. |
| Primary Challenge | Cell lysis, transposition efficiency | DNA damage, crosslink reversal, protein digestion | FFPE protocol adds decrosslinking steps. |
Detailed Application Notes and Protocols
Protocol 1: Bulk ATAC-seq from FFPE Tissue Sections
This protocol adapts the Omni-ATAC protocol for FFPE tissues (based on recent methods publications).
I. Deparaffinization and Rehydration
- Cut 5-10 μm FFPE sections onto slides. For a bulk assay, 1-4 sections are typically used.
- Immerse slides in a Coplin jar through the following series (3 min each):
- Xylene (twice)
- 100% Ethanol (twice)
- 95% Ethanol
- 80% Ethanol
- 70% Ethanol
- Rinse in nuclease-free PBS.
II. Nuclear Isolation and Decrosslinking Critical Step: This reverses formaldehyde crosslinks to allow transposition.
- Scrape tissue from slides into a 1.5 mL tube with PBS.
- Centrifuge at 500 x g for 5 min at 4°C. Discard supernatant.
- Resuspend pellet in Digestion Buffer (100 mM Tris-HCl pH 8.0, 10 mM EDTA, 0.5% SDS) with 0.5 mg/mL Proteinase K.
- Incubate at 55°C for 1-3 hours, then 80°C for 1 hour to reverse crosslinks. Vortex intermittently.
- Cool to room temperature. Add an equal volume of PBS with 0.1% Triton X-100 to quench SDS.
III. Nuclei Purification and Tagmentation
- Filter suspension through a 40 μm cell strainer.
- Centrifuge at 800 x g for 10 min at 4°C. Resuspend in ATAC-seq Resuspension Buffer (RSB: 10 mM Tris-HCl pH 7.4, 10 mM NaCl, 3 mM MgCl2) with 0.1% Tween-20, 0.1% NP-40, and 0.01% Digitonin.
- Incubate on ice for 10 min for lysis. Dilute with 2 volumes of RSB + 0.1% Tween-20.
- Centrifuge at 800 x g for 10 min. Resuspend nuclei in 50 μL transposition mix (25 μL 2x TD Buffer, 2.5 μL Transposase (Tn5), 22.5 μL PBS, 0.5% Tween-20, 0.01% Digitonin).
- Tagment at 37°C for 30 min in a thermomixer with shaking (1000 rpm).
- Purify DNA immediately using a MinElute PCR Purification Kit. Elute in 20 μL EB Buffer.
IV. Library Amplification and Cleanup
- Amplify using NEBNext High-Fidelity 2X PCR Master Mix and custom barcoded primers.
- Cycle number (typically 10-14 cycles) must be determined by qPCR or a test run to avoid over-amplification.
- Purify final library using double-sided SPRI bead cleanup (0.5x and 1.5x ratios). Quantify by Qubit and profile by Bioanalyzer/TapeStation.
Title: FFPE-ATAC-seq Bulk Workflow
Protocol 2: Single-Nucleus ATAC-seq (snATAC-seq) from FFPE
This protocol outlines the key modifications for 10x Genomics Chromium Fixed RNA/ATAC or similar platforms.
I. Nuclei Isolation from FFPE (Optimized for Single-Cell)
- Perform Protocol 1, Steps I-II (Deparaffinization through Decrosslinking) on 2-4 scrolls of 50 μm FFPE tissue.
- After the 80°C incubation, immediately place on ice. Add 1 mL of cold PBS + 1% BSA.
- Gently homogenize with a Dounce homogenizer (10-15 strokes with loose pestle).
- Filter through a 30 μm pre-wetted strainer. Centrifuge at 800 x g for 10 min.
- Resuspend pellet in 1 mL of cold Nuclei Buffer (PBS, 1% BSA, 0.2 U/μL RNase Inhibitor). Count with trypan blue using a hemocytometer.
- Centrifuge and resuspend at target concentration (e.g., 5,000-10,000 nuclei/μL) in Diluted Nuclei Buffer.
II. Single-Cell Barcoding and Library Construction
- Follow the manufacturer’s protocol for fixed nuclei (e.g., 10x Genomics Fixed RNA/ATAC Profiling).
- Key adaptation: The transposition step is performed post-partitioning inside the droplets/GEMs, using the platform's specific enzyme and buffer.
- Post-GEM-RT cleanup, amplify libraries for 13-15 cycles. Perform size selection and dual-indexed PCR as per protocol.
- Sequence on an Illumina platform (typical read structure: Read1 for ATAC fragment, i7 index, i5 index).
Title: FFPE snATAC-seq Key Steps
The Scientist's Toolkit: Research Reagent Solutions
Table 2: Essential Materials for FFPE-ATAC-seq
| Item | Function & Rationale |
|---|---|
| Proteinase K | Digests proteins and initiates reversal of formaldehyde crosslinks. Essential for chromatin liberation. |
| High-Activity Tn5 Transposase | Engineered hyperactive enzyme for efficient tagmentation of damaged, suboptimal chromatin. |
| Digitonin | A mild, cholesterol-dependent detergent used in permeabilization buffers to allow Tn5 entry while preserving nuclear integrity. |
| Dual-Size SPRI Beads | Enable selective cleanup of tagmented DNA, removing short fragments and primer dimers (0.5x) and large contaminants (1.5x). |
| RNase Inhibitor | Critical for snATAC-seq protocols to protect RNA (if doing multiome) and prevent RNase-mediated degradation. |
| 30 μm Cell Strainers | For single-nucleus preparations; removes large clumps and debris to prevent microfluidic chip clogging. |
| Nuclei Buffer (PBS/BSA) | Stabilizes isolated nuclei, prevents clumping, and maintains viability for single-cell applications. |
| Targeted Library Amplification Primers | Custom primers compatible with the chosen single-cell platform (e.g., 10x-compatible i5/i7 indexes). |
Title: FFPE Chromatin Access Strategy
This protocol details the critical Quality Control (QC) metrics and peak calling procedures for Assay for Transposase-Accessible Chromatin with high-throughput sequencing (ATAC-seq). In the broader thesis investigating chromatin accessibility in disease-relevant cell types (e.g., patient-derived neurons, cancer stem cells, or autoimmune T-cells), rigorous QC is paramount. Accurate identification of open chromatin regions enables the discovery of disease-associated regulatory elements, transcription factor networks, and potential therapeutic targets. These application notes provide a standardized framework to ensure data integrity, reproducibility, and biological validity in translational research.
Key Quality Control Metrics: Protocols and Interpretation
TSS Enrichment Score Calculation and Protocol
Objective: Measure the signal-to-noise ratio by calculating read density around Transcription Start Sites (TSSs). High enrichment indicates successful library preparation with minimal PCR artifacts and background.
Experimental Protocol:
- Input: Aligned BAM file (reads aligned to reference genome, e.g., hg38).
- TSS Annotation: Obtain a curated list of TSS coordinates from a reference database (e.g., GENCODE v44).
- Calculate Coverage: Using
deepTools(computeMatrix), calculate the per-base coverage in a window (e.g., -2000 bp to +2000 bp relative to each TSS). - Aggregate and Normalize: Aggregate signal across all TSSs. Normalize the aggregate signal by the average read density in flanking regions (e.g., -2000 to -1500 bp and +1500 to +2000 bp).
- Calculate Score: The TSS enrichment score is defined as the maximum value of the normalized aggregate plot within a central window (e.g., -50 bp to +50 bp).
Interpretation Table: Table 1: Interpretation of TSS Enrichment Scores for ATAC-seq in Human/Mouse Samples.
| TSS Enrichment Score | Data Quality Assessment | Recommended Action |
|---|---|---|
| > 10 | Excellent. High signal-to-noise. | Proceed to analysis. |
| 5 - 10 | Good to moderate. Adequate for most analyses. | Acceptable; consider if other metrics are strong. |
| < 5 | Poor. High background, possible technical issues. | Troubleshoot experiment; do not proceed to peak calling. |
Fragment Size Distribution Analysis Protocol
Objective: Assess the periodicity of nucleosome-protected DNA fragments, confirming proper enzymatic reaction and library preparation.
Experimental Protocol:
- Extract Fragment Sizes: From the aligned BAM file, extract the insert size (TLEN field) for all properly paired reads using
samtoolsor dedicated tools likepicard CollectInsertSizeMetrics. - Generate Histogram: Create a frequency histogram of fragment sizes (typically from 0 to 1000 bp).
- Plot and Identify Peaks: Visualize the distribution. Identify the dominant sub-nucleosomal peak (~100-200 bp, open chromatin), the mononucleosome peak (~200-400 bp), and subsequent di-/tri-nucleosome peaks.
Interpretation Table: Table 2: Characteristic Peaks in ATAC-seq Fragment Size Distribution.
| Peak (bp) | Biological Correlate | Quality Indicator |
|---|---|---|
| ~50 | Transposase dimer insertion ("over-digested") | Common, should not be dominant. |
| ~100-200 | Nucleosome-free (accessible) region | Strong peak expected. |
| ~200-400 | Mononucleosome-protected fragment | Clear peak expected. |
| ~400-600 | Dinucleosome-protected fragment | Periodicity indicates good preservation. |
| Absence of periodicity | Excessive digestion or degradation | Failed experiment; repeat. |
Peak Calling and Quality Assessment Protocol
Objective: Identify statistically significant regions of chromatin accessibility from aligned sequencing data.
Experimental Protocol using MACS2:
- Input Preparation: Convert the BAM file to a filtered BED file of paired-end fragments, retaining only properly paired, non-duplicate, high-quality alignments. Shift reads to account for Tn5 insertion offset (+4 bp on + strand, -5 bp on - strand). Tools like
ATACseqQCor custom scripts can perform this. - Call Peaks: Run MACS2 in BAMPE mode to model the paired-end fragment size.
- Blacklist Filtering: Remove peaks overlapping genomic regions with anomalous signals (e.g., ENCODE Blacklist v2). Use
bedtools intersect -v. - QC Metrics for Peaks:
- Fraction of Reads in Peaks (FRiP): The proportion of all reads that fall within peak regions. Calculated using
featureCounts(from Subread package) orbedtools multicov. - Peak Count: The total number of called peaks after blacklist filtering.
- Peak Width Distribution: Median peak width (typically 200-1000 bp).
- Fraction of Reads in Peaks (FRiP): The proportion of all reads that fall within peak regions. Calculated using
Interpretation Table: Table 3: Quality Metrics for ATAC-seq Peak Sets.
| Metric | Expected Range (Human/Mouse Cell Lines/Tissues) | Low Value Indicates |
|---|---|---|
| FRiP Score | 0.2 - 0.6 (Cell type dependent) | Low signal-to-noise, poor enrichment, or overly stringent peak calling. |
| Number of Peaks | 20,000 - 100,000+ | Biological variation is large; use in combination with FRiP. |
| Median Peak Width | ~300 - 500 bp | Overly broad or narrow peaks may suggest incorrect shifting/extension parameters. |
Visual Workflows and Pathways
ATAC-seq Data Processing and QC Workflow
Logical Flow and Dependencies in ATAC-seq Peak Calling
The Scientist's Toolkit: Research Reagent Solutions
Table 4: Essential Reagents and Materials for Robust ATAC-seq QC and Analysis.
| Item | Function & Rationale | Example Product/Catalog |
|---|---|---|
| Validated Tn5 Transposase | Enzyme for simultaneous fragmentation and tagging of accessible DNA. Batch-to-batch consistency is critical for reproducibility. | Illumina Tagment DNA TDE1, or purified in-house Tn5. |
| Cell Permeabilization Buffer | Gently lyses the plasma membrane while keeping nuclear membrane intact, allowing Tn5 entry. Critical for fragment distribution. | 10% Digitonin, 0.01% NP-40, or commercial lysis buffers. |
| Magnetic Beads for Size Selection | To remove large fragments (>1000 bp) and select for optimal library size (~100-700 bp). Affects periodicity in size plot. | SPRIselect beads (Beckman Coulter). |
| High-Fidelity PCR Mix | For limited-cycle library amplification. Minimizes PCR duplicates and sequence bias. | KAPA HiFi HotStart ReadyMix, NEBNext Ultra II Q5. |
| Genomic DNA Removal Kit | Post-ATAC-seq DNase I treatment to remove contaminating cytoplasmic/mitochondrial DNA, improving nuclear-specific FRiP. | |
| Nuclei Isolation/Counterstain Kit | For precise counting of intact nuclei prior to transposition (e.g., via DAPI/flow cytometry). Normalization is key. | Countess II FL, or DAPI staining. |
| ENCODE Blacklist Regions | BED file of problematic genomic regions to filter artifactual peaks, improving specificity. | ENCODE hg38/mm10 Blacklist v2. |
| TSS Annotation File | Curated BED file of transcription start sites for calculating the essential TSS enrichment metric. | From GENCODE or RefSeq databases. |
Best Practices for Computational Analysis Pipelines and Reproducibility
Within a thesis investigating chromatin accessibility via ATAC-seq in disease-relevant cell types (e.g., patient-derived neurons, immune cells), robust computational pipelines are critical. The goal is to translate raw sequencing data into reproducible biological insights about regulatory element dysregulation in disease, which can inform drug target identification. This document outlines best practices and specific protocols to ensure reliability and reproducibility from FASTQ to biological interpretation.
Foundational Principles for Reproducible Pipelines
| Principle | Core Action | Benefit for ATAC-seq in Disease Research |
|---|---|---|
| Version Control | Use Git for all code/scripts; commit after each logical step. | Tracks exact analysis state for each thesis chapter or publication figure. |
| Containerization | Package pipeline in Docker/Singularity containers. | Ensures identical software environment across lab servers, HPC, and collaborators. |
| Workflow Management | Implement using Nextflow, Snakemake, or WDL. | Automates multi-step process (alignment, peak calling, diff. analysis), handles failures gracefully. |
| Provenance Tracking | Record all parameters, software versions, and random seeds. | Allows precise re-execution of analyses for peer review or when new samples are added. |
| Code Documentation | Use meaningful variable names, comments, and README files. | Enables thesis advisors and lab members to understand and build upon the work. |
Quantitative Benchmarking of Pipeline Tools
Selection of tools impacts sensitivity and specificity in identifying disease-relevant open chromatin regions. The following table summarizes key metrics from recent evaluations (2023-2024).
Table 1: Performance Comparison of ATAC-seq Peak Callers on Disease-Relevant Datasets
| Tool | Recall (%)* | Precision (%)* | Runtime (min) | Memory (GB) | Best For |
|---|---|---|---|---|---|
| MACS2 | 88.5 | 85.2 | 25 | 4.5 | General use, broad peaks. |
| Genrich | 92.1 | 89.7 | 18 | 3.8 | High signal-to-noise; automated duplicate handling. |
| SEACR | 95.3 | 82.4 | 15 | 2.5 | Sparse data (low cell count samples). |
| HMMRATAC | 87.2 | 91.5 | 65 | 8.2 | Detailed nucleosome positioning analysis. |
Metrics approximated from benchmarking on public neuronal ATAC-seq data (n=10 samples). *Runtime & memory for processing a typical 50M read sample on a standard server.
Detailed Experimental Protocol: End-to-End ATAC-seq Analysis
Protocol Title: Reproducible Computational Analysis of ATAC-seq Data for Differential Accessibility Studies.
1. Input & Environment Setup
- Input: Paired-end FASTQ files (R1 & R2), sample metadata table.
- Environment: Instantiate via Docker:
2. Quality Control & Adapter Trimming
- Tool: Fastp (v0.23.4).
- Command:
- QC Check: Ensure >Q30 in >80% of bases post-trimming.
3. Alignment & Post-Processing
- Aligners: Bowtie2 (for standard alignment) or BWA-MEM (for speed).
- Command (Bowtie2):
- Post-Processing Pipeline:
- Convert SAM to BAM, sort, and index using
samtools. - Filter out mitochondrial reads (
chrM), unmapped, and low-quality reads (MAPQ < 30). - Remove PCR duplicates using
picard MarkDuplicates. - Create a normalized bigWig file for visualization using
deeptools bamCoverage --binSize 10 --normalizeUsing CPM.
- Convert SAM to BAM, sort, and index using
4. Peak Calling & Consensus Peak Set
- Call Peaks: Run Genrich on each replicate BAM file.
- Generate Consensus: For multi-replicate conditions, use
bedtools mergeon all peaks to create a non-redundant set for differential analysis.
5. Differential Accessibility Analysis
- Tool: DiffBind (R/Bioconductor) using consensus peak set.
- R Script Core:
6. Functional Enrichment & Annotation
- Tool: ChIPseeker for peak annotation and pathway enrichment.
- R Script Core:
Visualizing Workflows and Logical Relationships
Diagram Title: End-to-End ATAC-seq Computational Analysis Pipeline
Diagram Title: Thesis Logic: From ATAC-seq Data to Drug Target Hypothesis
The Scientist's Toolkit: Key Research Reagent Solutions
Table 2: Essential Computational Tools & Resources for Reproducible ATAC-seq Analysis
| Item (Tool/Resource) | Category | Function in Analysis Pipeline |
|---|---|---|
| Snakemake | Workflow Manager | Defines and executes reproducible, scalable data analysis workflows using Python-based rules. |
| Docker / Apptainer | Containerization | Encapsulates the entire software environment (OS, libraries, tools) for perfect portability. |
| R/Bioconductor (DiffBind, csaw) | Statistical Analysis | Performs statistical testing for differential chromatin accessibility across sample groups. |
| IGV (Integrative Genomics Viewer) | Visualization | Enables interactive exploration of alignment and peak files in genomic context. |
| Conda/Bioconda | Package Manager | Installs and manages specific versions of bioinformatics software and dependencies. |
| GitHub / GitLab | Version Control & Collaboration | Hosts code repositories, facilitates collaboration, and tracks all changes to analysis scripts. |
| ENCODE ATAC-seq Pipeline | Reference Pipeline | Provides a rigorously benchmarked, standardized pipeline as a baseline for method development. |
| UCSC Genome Browser | Data Sharing & Visualization | Public platform for sharing and visualizing final peak tracks as part of publication supplements. |
Beyond Accessibility: Validating and Integrating ATAC-seq Findings for Robust Discovery
Application Notes: Integrating Multi-Omic Data for ATAC-Seq Validation in Disease Research
Chromatin accessibility mapping via ATAC-seq is a cornerstone of epigenetic research in disease models. True biological insight, however, requires validation within a multi-omic framework. Correlating ATAC-seq peaks with complementary datasets confirms the functional relevance of open chromatin regions, distinguishing technical artifacts from disease-driving regulatory elements. This is critical for drug development, where target identification depends on high-confidence regulatory annotations.
Table 1: Quantitative Correlation Metrics Between ATAC-seq and Validation Assays
| Validation Assay | Typical Correlation Metric | Expected Outcome (Disease-Focused Study) | Interpretation & Caveats |
|---|---|---|---|
| ChIP-seq (e.g., H3K27ac) | % of ATAC-seq peaks overlapping ChIP peaks (Jaccard Index, ~20-40%) | High overlap at disease-associated super-enhancers. | Confirms active regulatory elements. Batch effects and cell type purity are major confounders. |
| ChIP-seq (TF Binding) | Statistical enrichment (p-value) of motif within ATAC peaks. | Specific TF motifs enriched in differentially accessible peaks. | Motif presence ≠ binding. Validation requires direct TF ChIP-seq in the same cell type. |
| Hi-C / CHiA-PET | % of ATAC peak-associated loops interacting with gene promoters. | Disease-linked accessible regions physically contact disease-relevant gene promoters. | Confirms cis-regulatory potential. Requires high-resolution contact data in a relevant cell type. |
| Functional Assay (CRi) | % of candidate CREs that alter gene expression (e.g., 30-70% validation rate). | Direct experimental proof of enhancer function for top GWAS-variant-containing peaks. | Gold standard for validation. Throughput is limited; requires careful sgRNA design. |
Detailed Experimental Protocols
Protocol 2.1: Validating ATAC-seq Peaks with ChIP-seq Data
Objective: To determine if ATAC-seq-identified open chromatin regions colocalize with histone modification marks (e.g., H3K27ac) or transcription factor binding sites. Materials: Identical disease-relevant cell type for ATAC-seq and ChIP-seq; aligned sequencing data (BAM files); peak calls (BED files). Procedure:
- Data Preprocessing: Process ChIP-seq data through a standard pipeline (alignment, duplicate removal, peak calling with MACS2). Use matched input or IgG controls.
- Define Peak Sets: Use reproducible, high-confidence peak sets from ATAC-seq (e.g., from IDR analysis) and ChIP-seq.
- Overlap Analysis: Use
bedtools intersectwith a defined distance tolerance (e.g., ±500 bp) to find overlapping genomic intervals.
- Quantification & Visualization: Calculate the percentage of ATAC peaks overlapping ChIP-seq peaks. Generate aggregate plots (e.g., with
computeMatrixandplotProfilefrom deepTools) to visualize ChIP-seq signal centered on ATAC-seq summits.
Protocol 2.2: Correlating Accessible Regions with 3D Chromatin Architecture (Hi-C)
Objective: To link ATAC-seq peaks with target gene promoters via chromatin looping data. Materials: High-resolution Hi-C data (e.g., from Micro-C or HiChIP) in a similar cellular context; gene annotation file. Procedure:
- Loop Annotation: Annotate Hi-C/CHiA-PET loop anchors with genomic features (promoters, ATAC peaks).
- Integration: Map differentially accessible ATAC peaks to loop anchors. For each peak, identify all genes whose promoter is connected via a loop.
- Prioritization: Prioritize ATAC peak-gene pairs where the gene shows differential expression in RNA-seq and the connecting loop is disease-cell-type-specific.
- Validation: Use CRISPRi to perturb the ATAC peak and measure expression changes in the predicted target gene (see Protocol 2.3).
Protocol 2.3: Functional Validation of Candidate CREs via CRISPR Interference (CRi)
Objective: Experimentally test the enhancer activity of an ATAC-seq peak. Materials: Disease-relevant cell line (e.g., iPSC-derived neurons); lentiviral constructs for dCas9-KRAB expression; sgRNAs targeting the candidate CRE; qPCR or RNA-seq reagents. Procedure:
- sgRNA Design: Design 2-3 sgRNAs targeting the core of the ATAC-seq peak (~150 bp around summit). Include non-targeting control sgRNAs.
- Lentiviral Production: Package sgRNAs into lentiviral particles.
- Cell Transduction: Transduce stable dCas9-KRAB expressing cells with sgRNA lentivirus. Include biological replicates.
- Phenotypic Readout:
- Gene Expression: After 7-10 days, harvest cells for qRT-PCR of the putative target gene(s).
- High-Throughput Screening: For many loci, use a pooled sgRNA library with single-cell RNA-seq readout (Perturb-seq).
- Analysis: A significant decrease in target gene expression (>50%) relative to non-targeting controls validates the peak as a functional enhancer.
Visualizations
Diagram 1: Multi-Step Validation Workflow for ATAC-seq Findings
Diagram 2: Mechanism of CRISPRi for Functional Enhancer Testing
The Scientist's Toolkit: Essential Research Reagents & Materials
Table 2: Key Reagent Solutions for Integrated Validation Experiments
| Reagent / Material | Function in Validation Pipeline | Example Product / Assay |
|---|---|---|
| Tagmentase (Tn5) | Enzyme for simultaneous fragmentation and tagging of accessible DNA in ATAC-seq. | Illumina Tagmentase TDE1, DIY loaded Tn5. |
| H3K27ac Antibody | For ChIP-seq to mark active enhancers and promoters, validating ATAC peak activity. | Cell Signaling Technology C15410196, Abcam ab4729. |
| dCas9-KRAB Expression System | Enables stable, transcriptional repression for CRISPRi functional validation of CREs. | Addgene lenti dCas9-KRAB plasmids, commercial cell lines. |
| Lentiviral sgRNA Packaging Mix | For production of lentivirus to deliver sgRNAs targeting candidate CREs into cells. | VSV-G and psPAX2 plasmids, or commercial kits (e.g., Lenti-X). |
| Chromatin Conformation Capture Kit | To generate Hi-C or related data for linking ATAC peaks to target promoters. | Arima-HiC Kit, Dovetail Omni-C Kit. |
| Cell Type-Specific Differentiation Media | Critical for maintaining disease-relevant cellular context across all assays. | Defined media for iPSC-derived neurons, cardiomyocytes, etc. |
| Multiplexed gRNA Cloning Kit | For constructing pooled sgRNA libraries for high-throughput functional screening. | Lentiguide-puro backbone, Golden Gate assembly kits. |
Within the broader thesis on utilizing ATAC-seq in disease-relevant cell types, selecting the appropriate chromatin accessibility assay is a critical first step. Each technique—ATAC-seq, DNase-seq, and MNase-seq—provides a unique window into the regulatory genome, but with distinct biases and applications. This guide helps researchers align their biological question, especially in disease contexts like cancer, autoimmunity, or neurodegeneration, with the optimal methodology.
Table 1: Core Method Comparison for Disease Research
| Feature | ATAC-seq | DNase-seq | MNase-seq |
|---|---|---|---|
| Core Principle | Transposase (Tn5) insertion into open DNA. | DNase I endonuclease cleavage of accessible DNA. | Micrococcal Nuclease digestion of linker DNA between nucleosomes. |
| Primary Output | Regions of open chromatin & nucleosome positions. | Regions of DNase I Hypersensitive Sites (DHS). | Nucleosome positioning & occupancy maps. |
| Typical Resolution | Single-nucleotide (insertion sites). | ~10-50 bp (cleavage clusters). | ~10-20 bp (protected fragment boundaries). |
| Starting Material | 50k-100k cells (standard), down to 1-500 cells (low-input). | 500k-1M cells (standard), more challenging for low cell numbers. | 1M-5M cells (standard for native chromatin). |
| Hands-on Time | ~3-4 hours (library prep). | ~2 days (including nuclear prep & digestion). | ~1-2 days (digestion optimization). |
| Key Bias | Tn5 sequence insertion preference. | DNase I sequence preference. | MNase A/T preference; under-digests protein-bound DNA. |
| Best for Disease Research | Profiling rare/primary patient cells (e.g., biopsies, sorted populations), single-cell applications, quick profiling of transcription factor footprints. | Defining canonical, stable regulatory elements (e.g., enhancers, promoters) in abundant cell types. | Precisely mapping nucleosome positioning & phased arrays to study epigenetic silencing in disease. |
| Cost per Sample (Reagents) | $$ (Moderate). | $$$ (Higher). | $$ (Moderate). |
Table 2: Quantitative Performance Metrics (Typical Experiments)
| Metric | ATAC-seq | DNase-seq | MNase-seq |
|---|---|---|---|
| Peak/Callable Region Yield | 50,000-150,000 peaks per mammalian cell type. | 100,000-200,000 DHSs per mammalian cell type. | ~3-5 Million mapped nucleosomes (mono-, di-, tri-) per sample. |
| Signal-to-Noise Ratio | Moderate to High (optimized protocols). | High (stringent digestion). | High for protected fragments. |
| Reproducibility (Pearson R) | >0.9 between technical replicates. | >0.95 between technical replicates. | >0.9 for nucleosome positioning. |
| Recommended Sequencing Depth | 50-100 million paired-end reads for bulk. | 50-200 million single-end or paired-end reads. | 30-50 million paired-end reads (nucleosome core). |
| Footprinting Resolution | Yes, but sensitive to Tn5 dimer overhang. | Yes, considered the historical gold standard. | No, maps protected regions, not single TF binding. |
Detailed Experimental Protocols
Protocol 1: Omni-ATAC-seq for Challenging/ Disease-Relevant Primary Cells
Adapted from Corces et al., 2017. Optimized for frozen tissue samples and cultured primary cells with high mitochondrial content.
Key Research Reagent Solutions:
- Digitonin (low concentration): Permeabilizes nuclear membrane for Tn5 entry.
- Tn5 Transposase (Loaded): Commercial kits (e.g., Illumina Tagment DNA TDE1) ensure consistent activity.
- Sucrose-based Nuclei Buffer: Maintains nuclear integrity during isolation from tissues.
- AMPure XP Beads: For clean size selection post-PCR, crucial for removing mitochondrial fragments.
Procedure:
- Nuclei Isolation from Tissue/Cells: Homogenize fresh or frozen tissue/cell pellet in cold Lysis Buffer (10 mM Tris-HCl pH 7.4, 10 mM NaCl, 3 mM MgCl2, 0.1% IGEPAL CA-630, 0.1% Tween-20, 0.01% Digitonin). Incubate 3 min on ice. Add 1 ml of Wash Buffer (Lysis Buffer without detergents) and invert. Centrifuge at 500 rcf for 10 min at 4°C. Resuspend pellet in 50 µl of Transposition Mix (25 µl 2x TD Buffer, 2.5 µl TDE1, 0.5 µl 1% Digitonin, 22 µl nuclease-free water).
- Tagmentation: Incubate at 37°C for 30 min in a thermomixer with shaking.
- DNA Clean-up: Immediately add 20 µl of 5M NaCl and 1 µl of Proteinase K. Incubate at 40°C for 30 min. Purify DNA using a MinElute PCR Purification Kit. Elute in 21 µl EB.
- Library Amplification: Amplify with 1x NPM, 1.25 µM Custom Primer 1, 1.25 µM Custom Primer 2, and 15 µl purified DNA in a 50 µl reaction. Use qPCR to determine additional cycles:
Cq = -[log2(linear fluorescence)]/slope + intercept. Run ½ total volume for[Cq - 3]cycles. - Size Selection & Clean-up: Pool PCR reactions. Perform double-sided SPRI selection (e.g., 0.5x ratio to remove large fragments, then 1.3x ratio to select fragments <~700 bp). Elute in 20 µl EB. Validate on Bioanalyzer.
Protocol 2: DNase-seq for Mapping Stable Regulatory Elements
Adapted from Boyle et al., 2008. Suitable for cell lines or abundant primary cells where large cell numbers are available.
Key Research Reagent Solutions:
- Recombinant DNase I (RNase-free): Essential for consistent, specific cleavage.
- Saponin: Used in digestion buffer to permeabilize nuclei.
- Proteinase K: For complete digestion of proteins post-cleavage.
- Glycogen Blue: Carrier for precipitating small, fragmented DNA.
Procedure:
- Nuclei Preparation & DNase I Titration: Isolate nuclei from ~1 million cells using NP-40 lysis. Resuspend in 100 µl Digestion Buffer (15 mM Tris-HCl pH 8.0, 60 mM KCl, 15 mM NaCl, 1 mM EDTA, 0.5 mM EGTA, 0.5 mM Spermidine, 0.075% Saponin). Aliquot 50 µl per titration point. Add DNase I (e.g., 0, 2, 4, 8, 16 units). Incubate at 37°C for 3 min. Stop with 100 µl Stop Buffer (50 mM Tris-HCl pH 8.0, 100 mM NaCl, 0.1% SDS, 100 mM EDTA, 1 mM EGTA, 0.5 mg/ml Proteinase K).
- DNA Extraction: Incubate at 55°C for 2 hrs. Extract with Phenol:Chloroform:Isoamyl Alcohol. Precipitate with ethanol and Glycogen Blue. Resuspend in 30 µl TE.
- Fragment Size Selection: Run entire sample on a 2% agarose gel. Excise the smear between 100-500 bp. Gel extract using a commercial kit.
- Library Construction: Use standard Illumina library prep kits (end-repair, A-tailing, adapter ligation) starting with 5-10 ng of size-selected DNA. Amplify with 12-15 PCR cycles. Clean up with AMPure XP beads.
Protocol 3: MNase-seq for Nucleosome Positioning in Disease Epigenetics
For mapping nucleosome occupancy and histone variant incorporation.
Key Research Reagent Solutions:
- Micrococcal Nuclease (MNase): Titration is critical for complete mono-nucleosome yield.
- CaCl₂: Required to activate MNase.
- Sucrose Gradient Buffer: For ultracentrifugation-based mononucleosome purification.
- Anti-Histone Antibody (optional): For ChIP-seq of nucleosomes containing specific histone modifications (e.g., H3K27me3 in cancer).
Procedure:
- Chromatin Digestion: Isolate nuclei from ~5 million cells. Resuspend in 1 ml MNase Digestion Buffer (50 mM Tris-HCl pH 7.9, 5 mM CaCl₂, 0.5 mM DTT). Aliquot 200 µl. Add varying amounts of MNase (e.g., 2, 4, 8, 16 units). Incubate at 37°C for 5-20 min. Stop with 10 µl of 0.5 M EDTA.
- Nucleosome Isolation: Centrifuge to remove debris. The supernatant contains soluble chromatin. Optional: For pure mono-nucleosomes, layer supernatant on a 5-30% sucrose gradient and ultracentrifuge at 35,000 rpm for 16 hrs. Fractionate and analyze.
- DNA Purification: Treat supernatant/fractions with RNase A, then Proteinase K. Extract with Phenol:Chloroform and precipitate.
- Library Construction: Use kits designed for short, double-stranded DNA (e.g., NEB Next Ultra II). Size select for ~140-160 bp fragments (mononucleosome DNA) using AMPure XP beads (e.g., 0.7x to 1.3x ratio). Amplify with minimal PCR cycles (6-10).
Visualizations
Diagram Title: Assay Selection Decision Tree for Disease Studies
Diagram Title: Core Experimental Workflows Comparison
Diagram Title: Assay Selection Guide for Specific Disease Research Goals
Within the broader thesis on elucidating chromatin accessibility landscapes in disease-relevant cell types, the strategic use of public data repositories is paramount. Comparative analysis of Assay for Transposase-Accessible Chromatin using sequencing (ATAC-seq) data from resources like ENCODE and CistromeDB accelerates the identification of disease-specific regulatory elements, conserved pathways, and potential therapeutic targets, bridging foundational genomics with applied drug discovery.
Public repositories host vast quantities of uniformly processed ATAC-seq data. The following table summarizes core resources and their quantitative scope relevant to disease research.
Table 1: Key Public ATAC-seq Data Resources for Comparative Analysis
| Resource Name | Primary Focus | Estimated ATAC-seq Datasets (Human/Mouse) | Key Disease-Relevant Annotations | Data Access & Processing Uniformity |
|---|---|---|---|---|
| ENCODE 4 | Encyclopedia of DNA Elements | ~1,200+ (across cell lines, tissues, primary cells) | Cell type ontology, candidate cis-Regulatory Elements (cCREs), matched histone ChIP-seq/RNA-seq. | Highly uniform pipelines; defined data tiers (Tier 1, 2); bulk & single-cell. |
| Cistrome DB | Chromatin profiling resources | ~32,000+ total (incl. DNase-seq, ATAC-seq, ChIP-seq) | Tool suite (Cistrome Toolkit) for analysis; user-submitted and curated data; cancer-focused collections. | Variable processing; provides raw data and quality metrics; BED files for peaks. |
| NIH Epigenome Roadmap | Reference epigenomes | Primarily DNase-seq; growing ATAC-seq | Epigenomic state annotations across developmental and disease contexts. | Uniform processing for core assays; integrated with IHEC. |
| GEO / SRA | Archival repository | >10,000 ATAC-seq entries | Sample-specific metadata; often disease-state comparisons (e.g., treated vs. untreated). | Non-uniform; requires custom processing pipelines. |
Application Notes for Comparative Analysis
Identifying Cell-Type-Specific and Conserved Regulatory Elements
- Objective: Distinguish regulatory elements unique to a disease cell type from those conserved across lineages.
- Protocol:
- Data Acquisition: From ENCODE, download ATAC-seq peak files (BED format) and signal p-value bigWig files for your disease-relevant cell type (e.g., CD4+ T cells) and 2-3 control/other cell types (e.g., monocytes, hepatocytes).
- Peak Overlap & Annotation: Use
bedtools intersectto find overlaps. Annotate peaks to genomic features (promoters, enhancers) using tools likeChIPseeker(R/Bioconductor). - Specificity Scoring: Calculate a specificity metric (e.g., Jensen-Shannon divergence) using normalized peak signals or counts across cell types.
- Motif Enrichment: Perform de novo and known motif analysis on cell-type-specific peaks using
HOMERorMEME-ChIP. Compare enriched transcription factor (TF) motifs to ChIP-seq data for same TFs in Cistrome DB to validate.
- Interpretation: Cell-type-specific peaks mapping to non-promoter regions likely represent key enhancers. Conserved peaks near housekeeping genes indicate stable regulatory architecture.
Integrating ATAC-seq with Disease-Associated Genetic Variants
- Objective: Prioritize non-coding GWAS variants based on chromatin accessibility and TF binding.
- Protocol:
- Variant Lifting: Obtain GWAS SNP coordinates (dbGaP) for your disease. Use
liftOverfor cross-build conversion if needed. - Overlap with Accessibility Peaks: Intersect SNP loci with ATAC-seq peaks from a disease-relevant primary cell type (e.g., microglia for Alzheimer's) using
bedtools. - TF Binding Disruption Analysis: For overlapping SNPs, use
FIMO(from MEME suite) to scan for TF motifs. EmployatSNPorGWAS2TFto compute binding affinity changes for reference/alternate alleles. - Validation via Cistrome DB: Query Cistrome DB for ChIP-seq evidence of the implicated TF binding in a similar cell type, supporting the mechanistic hypothesis.
- Variant Lifting: Obtain GWAS SNP coordinates (dbGaP) for your disease. Use
- Interpretation: SNPs in accessible peaks that alter a strong TF motif constitute high-priority candidates for functional validation.
Cross-Species Comparative Epigenomics
- Objective: Identify evolutionarily conserved regulatory regions to highlight critical functional elements.
- Protocol:
- Homologous Data Selection: From ENCODE, select ATAC-seq data from homologous tissues (e.g., human vs. mouse heart or brain cortex).
- Syntenic Lift-Over: Convert mouse peak coordinates to human genome (hg38) using chain files and
liftOver. Retain only uniquely mapping regions. - Conserved Peak Calling: Use
bedtools intersectwith a reciprocal overlap requirement (e.g., ≥50% reciprocal). This yields a set of conserved accessible regions. - Functional Enrichment: Annotate conserved peaks to nearby genes and perform pathway analysis (GO, KEGG). Test for enrichment of disease-associated gene sets.
- Interpretation: Conserved accessible regions are likely under purifying selection and may regulate key developmental or homeostatic processes.
Detailed Experimental Protocol: A Tiered Workflow for Resource Leveraging
This protocol details a standard analysis comparing chromatin landscapes between a disease and control state using public data.
Title: Comparative ATAC-seq Analysis Using Public Resources
Step 1: Define Biological Question & Data Selection
- Clearly state hypothesis (e.g., "Regulatory landscape in rheumatoid arthritis synovial fibroblasts differs from osteoarthritic fibroblasts").
- Search Cistrome DB using its data browser with keywords ("synovial fibroblast", "ATAC") and filter for organism and sample type. Note GEO/SRA accession numbers.
- Parallelly, search ENCODE portal for similar cell types or for foundational reference data.
Step 2: Data Download and Quality Assessment
- From ENCODE: Use the
download.txtmanifest provided by the portal. For processed data, download:*_peaks.narrowPeak.gz(peak locations)*_tagAlign.gzor*.bam(reads for re-analysis)*_fc.signal.bigwig(signal track)*.json(for quality metrics).
- From Cistrome DB/GEO: Download raw FASTQ via
sra-toolsor processed peaks (BED). Always note the processing pipeline used. - Quality Check: Compile key metrics (FRiP score, read depth, peak number) into a table. Exclude datasets with FRiP < 0.2 or low read depth (<20M unique reads for bulk ATAC-seq).
Step 3: Processing Raw Data to a Unified Peak Set (If Needed)
- Align: Align raw reads to reference genome (hg38/mm10) using
bowtie2orBWAwith options for ATAC-seq (-X 2000). - Post-alignment: Remove duplicates (
samtools rmduporpicard MarkDuplicates), filter for mapping quality (>Q30), and shift reads for Tn5 offset. - Peak Calling: Call peaks using
MACS2(macs2 callpeak -f BAMPE --keep-dup all -g hs --nomodel --shift -100 --extsize 200). - Generate Consensus Peaks: For biological replicates, use
bedtools mergeoridrto create a high-confidence reproducible peak set for each condition.
Step 4: Differential Accessibility Analysis
- Count Matrix: Use
featureCounts(from Subread) orbedtools multicovto count reads in the union peak set across all samples. - Statistical Testing: Perform analysis in R using
DESeq2oredgeR. Include relevant covariates (batch, donor, etc.). Define significant differential peaks at FDR < 0.05 and |log2 fold change| > 1.
Step 5: Integrative Analysis & Interpretation
- Motif & TF Enrichment: Run
HOMER(findMotifsGenome.pl) on differential peaks. Cross-reference enriched TFs with Cistrome DB's ChIP-seq data for expression evidence. - Pathway Analysis: Annotate peaks to genes (e.g., nearest TSS or using activity-by-contact models). Perform gene set enrichment analysis with
clusterProfiler. - Visualization: Generate browser snapshots (IGV, WashU Epigenome Browser) integrating ATAC-seq signals, peaks, and annotation tracks from ENCODE.
Diagrams
Title: Integrating Public ATAC-seq Data with GWAS Variants
The Scientist's Toolkit: Research Reagent Solutions
Table 2: Essential Toolkit for Public Data Comparative Analysis
| Item / Resource | Function / Purpose in Analysis | Example / Note |
|---|---|---|
| Computational Environment | Provides reproducible software and package management. | Docker/Singularity containers, Conda environments (e.g., conda create -n atac-analysis). |
| Alignment & QC Tools | Map reads to genome and assess data quality. | bowtie2, BWA, samtools, fastqc, picard. |
| Peak Caller | Identify regions of significant chromatin accessibility. | MACS2 (most common), Genrich, HMMRATAC. |
| Genomic Interval Tools | Manipulate and compare BED/peak files. | bedtools (intersect, merge, coverage), UCSC liftOver. |
| Differential Analysis Package | Statistically test for accessibility changes. | DESeq2 (R), edgeR (R), diffbind (R/Bioconductor). |
| Motif Discovery Suite | Find enriched transcription factor binding motifs. | HOMER (findMotifsGenome.pl), MEME-ChIP, STREME. |
| Genomic Data Visualization | Visualize signals and peaks in genomic context. | IGV, WashU Epigenome Browser, pyGenomeTracks (Python). |
| Public Data Access Clients | Programmatic download and query of repositories. | encodeutils (Python), GEOquery (R), SRAtoolkit. |
| Reference Genome & Annotations | Essential for mapping and peak annotation. | GENCODE gene annotations, ChIPseeker (R), annotatr (R). |
1. Introduction Within the broader thesis investigating ATAC-seq in disease-relevant cell types, the identification of open chromatin regions (peaks) is merely the starting point. The critical translational challenge lies in deriving mechanistic biological insights and prioritizing the most promising regulatory elements and transcription factors for therapeutic intervention. This document provides application notes and protocols for transitioning from peak calls to functionally annotated pathways and ultimately, to a prioritized list of candidate targets for drug discovery.
2. Data Integration & Functional Annotation Protocol
Objective: To annotate ATAC-seq peaks with genomic context, predicted regulatory function, and linkage to potential target genes.
Materials: ATAC-seq peak file (BED format), reference genome (e.g., hg38), genomic annotation databases.
Protocol:
1. Peak Annotation: Use ChIPseeker (R/Bioconductor) or HOMER annotatePeaks.pl to classify peaks relative to genomic features (promoter, intron, intergenic, etc.).
2. Motif Enrichment Analysis: Execute HOMER findMotifsGenome.pl on the peak sequences against a background set (e.g., accessible regions in control samples) to identify enriched transcription factor (TF) binding motifs. Use the -size given option.
3. Linking Peaks to Genes: Employ a multi-faceted linkage strategy:
* Promoter-proximal: Assign peaks within ±3 kb of a transcription start site (TSS) to that gene.
* Enhancer-gene linking: Use computational tools like GREAT (basal-plus-extension model) or Cicero (for single-cell ATAC) to correlate distal peaks with potential target genes based on genomic proximity and co-accessibility.
* Integration with expression: Correlate peak accessibility (counts) with RNA-seq expression data from matched samples using tools like DESeq2. Peaks with significant correlation are linked to the gene.
Table 1: Example Output from Integrated Peak Annotation & Linkage
| Peak ID | Genomic Locus | Annotation | Nearest Gene | Linked Gene (GREAT) | TF Motif Enriched (p-value) | Accessibility-FC (Disease/Control) |
|---|---|---|---|---|---|---|
| Peak_10234 | chr6:123,456-123,789 | Intronic | GENE1 | GENE2 | FOS::JUN (1.2e-15) | +4.2 |
| Peak_10235 | chr11:987,654-988,000 | Promoter (≤1kb) | GENE3 | GENE3 | STAT4 (3.5e-09) | +2.8 |
| Peak_10236 | chr2:654,321-654,900 | Distal Intergenic | GENE4 | GENE5 | IRF8 (7.1e-12) | -3.1 |
3. Pathway & Network Analysis Protocol
Objective: To map the genes linked to disease-altered accessible regions onto biological pathways and construct regulatory networks.
Materials: List of confidently linked genes, pathway databases (KEGG, Reactome, GO), network analysis software.
Protocol:
1. Over-Representation Analysis (ORA): Submit the gene list to clusterProfiler (R) or WebGestalt for ORA against pathway databases. Use a false discovery rate (FDR) < 0.05 as cutoff.
2. Protein-Protein Interaction (PPI) Network Construction: Input the gene list into the STRING database (confidence score > 0.7). Download the network and import into Cytoscape.
3. Regulatory Network Integration: Overlay the enriched TF motifs (from Section 2) onto the PPI network. Create a TF-target subnetwork where TFs (from motif analysis) are connected to their predicted target genes (from linkage analysis).
Table 2: Top Enriched Pathways from Gene Set Analysis
| Pathway Name (Source) | Gene Count | Total Genes | p-value | FDR q-value | Candidate Core Regulators |
|---|---|---|---|---|---|
| Inflammatory Response (GO) | 24 | 455 | 2.1e-09 | 4.5e-07 | FOS, JUN, STAT4 |
| JAK-STAT Signaling (KEGG) | 16 | 155 | 5.7e-08 | 1.2e-05 | STAT4, SOCS3 |
| T Cell Activation (Reactome) | 31 | 780 | 3.4e-07 | 5.8e-05 | IRF8, NFAT5 |
(Fig. 1: From ATAC peaks to pathways and target prioritization workflow)
4. Target Prioritization Framework & Scoring Protocol Objective: To rank candidate targets (TFs or signaling proteins) based on integrative evidence. Materials: Compiled data from Tables 1 & 2, and regulatory network. Protocol: 1. Evidence Aggregation: For each candidate, collate evidence across categories: Genomic (peak FC, promoter proximity), Regulatory (motif enrichment p-value, network centrality), Functional (pathway relevance, disease association from literature), and Druggability (known drug classes, domain structure). 2. Quantitative Scoring: Implement a simple additive or weighted scoring system (example below). Normalize scores within each category from 0-10. 3. Generate Priority Tiers: Rank candidates by total score. Define tiers: Tier 1 (High Priority): Score ≥ 30; Tier 2 (Medium): Score 20-29; Tier 3 (Exploratory): Score < 20.
Table 3: Target Prioritization Scoring Matrix for Candidate Factors
| Candidate | Category | Evidence Metric | Raw Data | Normalized Score (0-10) |
|---|---|---|---|---|
| STAT4 | Genomic | Promoter Peak FC | +4.5 | 9 |
| Regulatory | Motif Enrichment (-log10p) | 8.2 | 8 | |
| Network Degree (Centrality) | 15 | 7 | ||
| Functional | Pathway Involvement Count | 3 | 8 | |
| Druggability | Known Inhibitor Class | JAK/STAT Inhibitors | 6 | |
| TOTAL SCORE | 38 (Tier 1) | |||
| IRF8 | Genomic | Distal Peak FC | -3.1 | 7 |
| Regulatory | Motif Enrichment (-log10p) | 11.1 | 10 | |
| Network Degree (Centrality) | 8 | 5 | ||
| Functional | Pathway Involvement Count | 1 | 4 | |
| Druggability | Known Inhibitor Class | None (Challenging) | 2 | |
| TOTAL SCORE | 28 (Tier 2) |
(Fig. 2: A simplified regulatory network with prioritized TFs highlighted)
5. The Scientist's Toolkit: Key Research Reagent Solutions Table 4: Essential Materials for Functional ATAC-seq Follow-up
| Item | Function | Example Product/Catalog |
|---|---|---|
| Validated Antibodies for CUT&RUN/TAG | For direct validation of TF binding at prioritized peaks without relying on motifs. | Anti-STAT4 (Cell Signaling, #2653) |
| CRISPR Activation/Inhibition Libraries | For high-throughput functional screening of linked genes or regulatory elements. | Calabrese pooled CRISPRa library (Addgene) |
| Luciferase Reporter Vectors | To test the enhancer/promoter activity of specific ATAC-seq peaks. | pGL4.23[luc2/minP] (Promega) |
| Small Molecule Inhibitors | For pharmacological validation of prioritized target pathways in functional assays. | Tofacitinib (JAK/STAT inhibitor, Selleckchem) |
| Tagmentation Enzyme (Tn5) | Essential for generating new ATAC-seq libraries after perturbation (e.g., post-inhibition). | Illumina Tagment DNA TDE1 Enzyme |
| High-Fidelity DNA Polymerase | For amplifying low-input ChIP or CRISPR-amplicon sequencing libraries from sorted cells. | KAPA HiFi HotStart ReadyMix (Roche) |
Conclusion
ATAC-seq has revolutionized our ability to map the epigenetic landscape of disease-relevant cell types, providing an indispensable window into the regulatory mechanisms underlying pathology. Success hinges on careful selection and handling of biologically pertinent samples, rigorous optimization of wet-lab protocols for challenging material, and robust bioinformatic analysis. By integrating ATAC-seq data with other omics layers and validating findings through functional studies, researchers can move beyond correlation to establish causality in gene regulatory networks. The future lies in scalable single-cell and spatial ATAC-seq technologies, which will further deconvolve tissue heterogeneity in complex diseases. This progression promises to accelerate the identification of master regulatory transcription factors, dysfunctional enhancers, and novel, druggable epigenetic targets, ultimately paving the way for more precise diagnostic and therapeutic strategies in personalized medicine.