Decoding Gene Regulation: A Comprehensive Guide to ChIP-seq for Transcription Factor Binding Analysis
This article provides a comprehensive guide to Chromatin Immunoprecipitation followed by sequencing (ChIP-seq) for investigating transcription factor (TF) binding mechanisms.
Decoding Gene Regulation: A Comprehensive Guide to ChIP-seq for Transcription Factor Binding Analysis
Abstract
This article provides a comprehensive guide to Chromatin Immunoprecipitation followed by sequencing (ChIP-seq) for investigating transcription factor (TF) binding mechanisms. Targeted at researchers, scientists, and drug development professionals, it covers foundational principles, from the biology of TF-DNA interactions to the rationale behind ChIP-seq. It details state-of-the-art methodological workflows, including experimental design, peak calling, and motif discovery, with applications in disease research and therapeutic targeting. The guide addresses common troubleshooting scenarios and optimization strategies for robust data generation. Finally, it explores critical validation techniques and compares ChIP-seq to emerging alternatives like CUT&Tag and ATAC-seq. This resource synthesizes current best practices to empower precise genomic research and accelerate discoveries in gene regulation.
Unraveling the Blueprint: Core Principles of Transcription Factor Binding and ChIP-seq Fundamentals
The Central Dogma of molecular biology outlines the unidirectional flow of information from DNA to RNA to protein. Within this framework, the regulation of transcription is the primary control point for determining when, where, and to what extent a gene is expressed. Transcription factors (TFs) are the sequence-specific DNA-binding proteins that execute this control, acting as the central processors of cellular signaling and developmental cues. Their ability to bind specific genomic loci and recruit co-regulatory complexes directly dictates the transcriptional output of RNA polymerase II. This whitepaper details the molecular mechanisms by which TFs govern gene expression, framed within the essential context of modern functional genomics, particularly Chromatin Immunoprecipitation followed by sequencing (ChIP-seq), which has revolutionized our ability to discover and characterize TF binding mechanisms in vivo.
Core Mechanisms of Transcriptional Control by TFs
TFs operate through a coordinated series of molecular interactions. The process is hierarchical and combinatorial.
2.1 Sequence-Specific DNA Recognition TFs contain DNA-binding domains (DBDs) that recognize specific short (6-12 bp) DNA sequences or motifs. Binding affinity and specificity are influenced by local chromatin accessibility, DNA methylation, and nucleotide variations.
2.2 Chromatin Remodeling and Accessibility Pioneer factors, a subclass of TFs, can bind to compacted chromatin and initiate local decompaction, recruiting ATP-dependent chromatin remodeling complexes (e.g., SWI/SNF) to make DNA accessible for subsequent TF binding.
2.3 Recruitment of Co-regulatory Complexes Once bound, TFs recruit co-activators or co-repressors via their transactivation or repression domains. These complexes enzymatically modify the chromatin landscape.
- Co-activators (e.g., histone acetyltransferases like p300/CBP) add acetyl groups to histones, neutralizing their positive charge and loosening histone-DNA interactions.
- Co-repressors (e.g., histone deacetylases) remove acetyl groups, promoting chromatin compaction.
- Other complexes facilitate histone methylation or ubiquitination.
2.4 Direct Engagement of the Transcription Machinery The ultimate step is the recruitment of the general transcription factors (GTFs) and RNA Polymerase II (Pol II) to the core promoter, forming the pre-initiation complex (PIC). Key co-activators like the Mediator complex act as a molecular bridge between sequence-specific TFs and Pol II.
ChIP-seq: The Definitive Tool for Mapping TF Binding Landscapes
ChIP-seq is the cornerstone technology for investigating the principles outlined above within a living cellular context. It provides genome-wide, in vivo maps of protein-DNA interactions.
3.1 Detailed ChIP-seq Protocol for Transcription Factors
- Step 1: Crosslinking. Cells are treated with formaldehyde (1% final concentration) for 8-10 minutes at room temperature to covalently link TFs to their bound DNA.
- Step 2: Cell Lysis and Chromatin Shearing. Cells are lysed, and chromatin is isolated and fragmented via sonication to an average size of 200-500 bp using a focused ultrasonicator.
- Step 3: Immunoprecipitation. The sheared chromatin is incubated with a high-specificity antibody against the TF of interest. Antibody-chromatin complexes are isolated using Protein A/G magnetic beads.
- Step 4: Reverse Crosslinking and Purification. The immunoprecipitated material is treated with heat and Proteinase K to reverse crosslinks. DNA is purified using a column-based purification kit.
- Step 5: Library Preparation and Sequencing. The DNA fragments undergo end-repair, A-tailing, adapter ligation, and PCR amplification to create a sequencing library, which is then subjected to high-throughput sequencing (e.g., Illumina).
- Step 6: Bioinformatics Analysis. Sequencing reads are aligned to a reference genome. Peak-calling algorithms (e.g., MACS2) identify statistically significant regions of enrichment (binding sites). Motif discovery tools (e.g., MEME-ChIP) identify the bound DNA sequence motif.
3.2 Key Quantitative Metrics from ChIP-seq Analysis The following table summarizes core quantitative outputs from a typical ChIP-seq experiment for a transcription factor.
Table 1: Key Quantitative Outputs from TF ChIP-seq Analysis
| Metric | Typical Value/Range | Significance & Interpretation |
|---|---|---|
| Number of Peaks | 5,000 - 100,000 | Indicates the genome-wide binding burden and regulatory potential of the TF. |
| Peak Width (Median) | 200 - 1000 bp | Reflects the size of the protein-DNA complex; narrow peaks are typical for sequence-specific TFs. |
| Fraction of Peaks in Promoters | 10% - 40% | Suggests the TF's role in direct promoter regulation vs. distal enhancer regulation. |
| Peak Enrichment (Fold-Change) | 5-fold to >100-fold | Measures the signal-to-noise ratio; higher enrichment indicates more specific antibody and efficient IP. |
| Top De Novo Motif E-value | < 1e-10 | Statistical significance of the discovered sequence motif; lower E-value indicates a highly specific motif. |
| Motif Occurrence in Peaks | 20% - 80% | Percentage of peaks containing the canonical motif; lower % may indicate indirect binding or cooperative partners. |
Visualizing the Pathways and Workflows
Diagram 1: TF-Mediated Transcriptional Activation Pathway
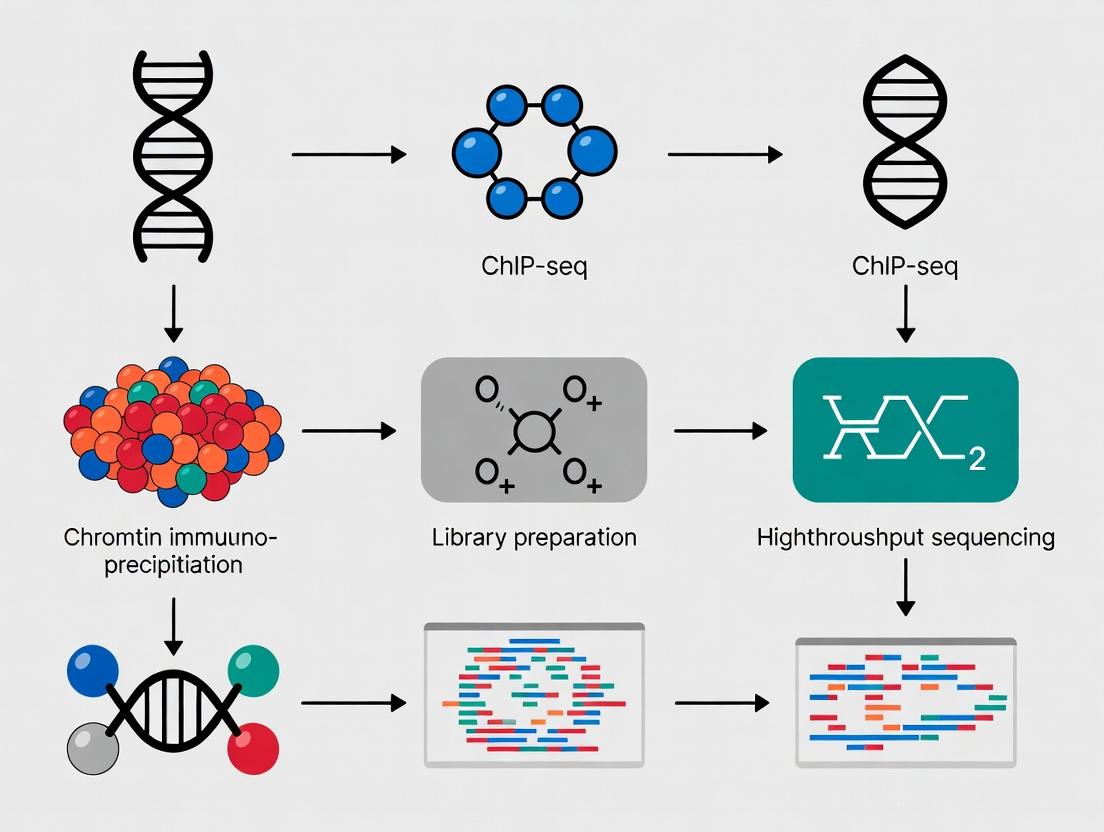
Diagram 2: ChIP-seq Experimental Workflow
The Scientist's Toolkit: Research Reagent Solutions
Table 2: Essential Reagents for TF ChIP-seq Experiments
| Reagent / Material | Function & Critical Specifications |
|---|---|
| High-Affinity, ChIP-Validated Antibody | Specific immunoprecipitation of the target TF. Must be validated for use in ChIP (check vendor databases like CST). Polyclonal often gives higher yield but may have lower specificity. |
| Protein A/G Magnetic Beads | Efficient capture of antibody-TF-DNA complexes. Magnetic beads facilitate gentle washing and reduce background compared to agarose beads. |
| Formaldehyde (37%) | Reversible crosslinking agent. Critical for capturing transient in vivo interactions. Quenching is performed with glycine. |
| Protease & Phosphatase Inhibitors | Preserve the integrity of the TF and its post-translational modifications during cell lysis and chromatin preparation. |
| Sonicator (Focused-Ultrasonicator) | Fragments chromatin to optimal size (200-500 bp). Focused sonicators are more efficient and consistent than bath sonicators. |
| DNA Clean/Concentration Kit (SPRI Beads) | Purification and size selection of immunoprecipitated DNA before library prep. More reproducible than phenol-chloroform extraction. |
| High-Sensitivity DNA Assay (e.g., Qubit) | Accurate quantification of low-concentration ChIP-DNA, crucial for successful library preparation. |
| ChIP-seq Library Prep Kit | Prepares sequencing libraries from low-input, fragmented DNA. Kits optimized for 50 pg-50 ng input are essential. |
| Control Antibodies | IgG: Negative control for non-specific binding. Anti-RNA Pol II (phospho S2/S5): Positive control for successful ChIP. |
| Spike-in Chromatin (e.g., from Drosophila cells) | Added before IP to normalize for technical variation between samples, enabling more accurate differential binding analysis. |
Understanding the central dogma of transcriptional control requires moving from in vitro motifs to in vivo binding maps. ChIP-seq provides the empirical foundation for this transition, allowing researchers to validate the mechanisms by which TFs govern gene expression—from pioneer factor action and chromatin opening to co-regulator recruitment and PIC assembly—in their native genomic and cellular context. This integration of biochemical mechanism with genome-wide discovery is fundamental for advancing research in developmental biology, disease pathogenesis, and the development of therapeutics that target transcriptional regulators.
This whitepaper, framed within a broader thesis on ChIP-seq's role in discovering transcription factor (TF) binding mechanisms, details the assay's biological and technical rationale. Chromatin Immunoprecipitation followed by sequencing (ChIP-seq) is the cornerstone for mapping protein-DNA interactions in vivo, enabling researchers to decipher the cis-regulatory code governing gene expression—a critical pursuit for understanding disease and developing therapeutics.
Biological Foundation: From Chromatin Architecture to Gene Regulation
The assay's rationale stems from the fundamental relationship between chromatin structure and function. DNA is packaged into chromatin by wrapping around histone octamers to form nucleosomes. Regulatory proteins like transcription factors, co-activators, and histones with post-translational modifications (PTMs) bind to specific genomic loci to control transcriptional output. ChIP-seq captures these transient interactions by covalently crosslinking proteins to DNA, isolating specific chromatin fragments via immunoprecipitation, and identifying the bound DNA sequences via high-throughput sequencing.
Diagram Title: From DNA Packaging to Transcription Factor Binding
Detailed ChIP-seq Protocol
Crosslinking
Purpose: Capture transient protein-DNA interactions. Protocol: Treat cells with 1% formaldehyde for 8-12 minutes at room temperature. Quench with 125mM glycine. Wash cells with cold PBS.
Chromatin Preparation & Fragmentation
Purpose: Generate DNA fragments suitable for immunoprecipitation. Protocol: Lyse cells. Isolate nuclei. Perform sonication using a focused ultrasonicator (e.g., Covaris) to shear crosslinked chromatin to 200-600 bp fragments. Validate fragment size via agarose gel electrophoresis.
Immunoprecipitation
Purpose: Enrich DNA fragments bound by the protein of interest. Protocol: Incubate chromatin with validated, protein-specific antibody (e.g., 1-10 µg) overnight at 4°C with rotation. Capture antibody-protein-DNA complexes using Protein A/G magnetic beads. Wash beads stringently with RIPA and LiCl buffers.
Reverse Crosslinking & Purification
Purpose: Isolate DNA from protein complexes. Protocol: Elute complexes from beads. Reverse crosslinks by incubating at 65°C overnight with NaCl. Treat with RNase A and Proteinase K. Purify DNA using silica membrane columns.
Library Preparation & Sequencing
Purpose: Prepare DNA for high-throughput sequencing. Protocol: End-repair, adenylate 3' ends, and ligate sequencing adapters to purified ChIP DNA. Size-select fragments (typically 200-500 bp). Amplify library via 8-12 PCR cycles. Validate library quality via Bioanalyzer. Sequence on platforms like Illumina NovaSeq (50-100 million single-end reads recommended for TFs).
Data Analysis & Key Metrics
Raw sequencing reads are aligned to a reference genome. Peak-calling algorithms (e.g., MACS2) identify statistically significant regions of enrichment compared to a control (Input DNA).
Table 1: Key ChIP-seq Quality Control Metrics
| Metric | Optimal Value | Purpose & Rationale |
|---|---|---|
| PCR Bottleneck Coefficient (PBC) | >0.9 (Ideal) | Measures library complexity. Low PBC indicates over-amplification and loss of unique sequences. |
| Non-Redundant Fraction (NRF) | >0.9 | Similar to PBC; fraction of unique, non-duplicate reads. |
| Fraction of Reads in Peaks (FRiP) | >1% (TFs), >10% (Histones) | Signal-to-noise measure. Indicates successful IP enrichment. |
| Cross-Correlation (NSC/ RSC) | NSC>1.05, RSC>0.8 | Assesses fragment length distribution. High RSC indicates strong strand-shift patterns from protein-bound fragments. |
| Peak Number (TF Example) | 10,000 - 50,000 | Varies by factor and cell type. Too few may indicate failed IP; too many may indicate noise. |
Table 2: Comparison of Common ChIP-seq Controls
| Control Type | Description | Role in Analysis |
|---|---|---|
| Input DNA | Sheared, non-immunoprecipitated genomic DNA. | Controls for open chromatin bias and sequencing artifacts. Essential for peak calling. |
| IgG | Immunoprecipitation with non-specific IgG. | Controls for non-specific antibody binding. Less critical if using validated antibody and Input. |
| Mock IP | IP without antibody. | Controls for bead-binding artifacts. |
| KO/KD Cell Line | Cells lacking the target protein. | Gold standard for confirming binding specificity. |
Diagram Title: ChIP-seq Experimental Workflow
The Scientist's Toolkit: Essential Research Reagents & Materials
Table 3: Key Reagent Solutions for ChIP-seq
| Item | Function & Rationale |
|---|---|
| Validated ChIP-grade Antibody | Specificity is paramount. Must be validated for ChIP application (e.g., by vendor or prior publications) to minimize off-target peaks. |
| Protein A/G Magnetic Beads | Efficient capture of antibody-antigen complexes. Magnetic beads simplify wash steps and reduce background. |
| Formaldehyde (37%) | Reversible crosslinker. Penetrates cells quickly to "freeze" protein-DNA interactions. |
| Protease Inhibitor Cocktail | Prevents degradation of target proteins and histones during chromatin preparation. |
| Covaris microTUBES & AFA Fiber | For consistent, focused ultrasonication to achieve desired chromatin fragment size with minimal heat damage. |
| SPRIselect Beads (Beckman Coulter) | For post-library prep size selection and clean-up. More consistent than traditional gel electrophoresis. |
| High-Fidelity DNA Polymerase (e.g., KAPA HiFi) | For limited-cycle library amplification to maintain complexity and reduce bias. |
| Sequencing Index Adapters | Enable multiplexing of multiple samples in a single sequencing lane, reducing cost. |
The ChIP-seq assay provides a direct biochemical pipeline from the native chromatin environment to genomic sequence data. Its biological rationale—capturing in vivo binding events within the context of nuclear architecture—makes it indispensable for deconstructing the regulatory networks driven by transcription factors and chromatin modifiers. Rigorous protocol optimization, stringent controls, and robust bioinformatic analysis are critical for generating mechanistic insights that can inform drug discovery targeting dysregulated gene expression programs.
Within the broader thesis on utilizing ChIP-seq for the discovery of transcription factor binding mechanisms, this guide outlines the comprehensive workflow. Understanding these mechanisms is pivotal for elucidating gene regulatory networks in development, disease, and therapeutic intervention. Chromatin Immunoprecipitation followed by sequencing (ChIP-seq) is the cornerstone technology for mapping protein-DNA interactions genome-wide.
Core Conceptual Workflow
Step 1: Crosslinking and Cell Lysis
The experiment begins by treating cells with formaldehyde to create covalent bonds between transcription factors and the DNA sequences they are bound to, as well as between histones and DNA. This "freezes" the protein-DNA interactions in place. Cells are then lysed to release the chromatin.
Step 2: Chromatin Fragmentation
The crosslinked chromatin is fragmented into smaller pieces, typically 150-600 base pairs in length. This is most commonly achieved using sonication (acoustic shearing) or enzymatic digestion (e.g., with micrococcal nuclease, MNase). The goal is to solubilize the chromatin while preserving protein-DNA complexes.
Step 3: Immunoprecipitation (IP)
The fragmented chromatin is incubated with a specific antibody that recognizes the protein of interest (e.g., a transcription factor, a histone modification, or RNA polymerase II). Antibody-bound complexes are then isolated using beads coated with Protein A or G. This step enriches DNA fragments bound by the target protein.
Step 4: Crosslink Reversal and DNA Clean-up
The immunoprecipitated complexes are treated to reverse the formaldehyde crosslinks, typically by incubation at high temperature, which separates the protein from the DNA. Proteins are then digested, and the purified DNA fragments (the "ChIP DNA") are recovered.
Step 5: Library Preparation and Sequencing
The ChIP DNA undergoes standard next-generation sequencing (NGS) library preparation: end repair, A-tailing, adapter ligation, and PCR amplification. The final library is sequenced on a platform such as Illumina, generating millions of short reads that correspond to the ends of the immunoprecipitated DNA fragments.
Step 6: Computational Data Analysis
The sequenced reads are aligned to a reference genome. Regions with significant enrichment of aligned reads (peaks) are identified using specialized algorithms, revealing the genomic binding sites of the protein of interest. Downstream analyses include motif discovery, annotation to genes, and integration with other omics data.
Detailed Methodologies for Key Experiments
Protocol A: Chromatin Immunoprecipitation (Steps 1-4)
- Crosslinking: For cultured cells, add 37% formaldehyde directly to growth medium to a final concentration of 1%. Incubate for 8-12 minutes at room temperature. Quench with 125mM glycine for 5 minutes.
- Lysis and Sonication: Wash cells and resuspend in lysis buffer (e.g., 50mM HEPES-KOH pH 7.5, 140mM NaCl, 1mM EDTA, 1% Triton X-100, 0.1% Na-Deoxycholate) with protease inhibitors. Sonicate using a focused ultrasonicator (e.g., Covaris) for 10-15 cycles (30 sec ON, 30 sec OFF) to achieve 200-500 bp fragments. Centrifuge to clear debris.
- Immunoprecipitation: Pre-clear chromatin with protein A/G beads for 1 hour. Incubate supernatant with 1-10 µg of specific antibody overnight at 4°C. Add beads and incubate for 2-4 hours. Wash beads sequentially with low-salt, high-salt, LiCl, and TE buffers.
- Elution and Decrosslinking: Elute complexes in elution buffer (1% SDS, 100mM NaHCO3). Add NaCl to 200mM and incubate at 65°C overnight to reverse crosslinks. Treat with RNase A and Proteinase K. Purify DNA using SPRI beads or phenol-chloroform extraction.
Protocol B: ChIP-seq Library Preparation (Step 5)
- End Repair & A-tailing: Use a commercial library prep kit (e.g., NEBNext Ultra II). Treat ChIP DNA with a mix of T4 DNA Polymerase, Klenow Fragment, and T4 PNK to create blunt ends. Then add a single 'A' nucleotide to the 3' ends using Klenow exo-.
- Adapter Ligation: Ligate indexed, double-stranded DNA adapters with a 'T' overhang to the 'A'-tailed DNA using T4 DNA Ligase.
- Size Selection and PCR Enrichment: Purify ligation product and select fragments in the 200-600 bp range using SPRI beads. Amplify the library with 10-15 cycles of PCR using primers complementary to the adapter sequences.
- QC and Sequencing: Quantify library by qPCR and check size distribution on a Bioanalyzer. Pool libraries and sequence on an Illumina NovaSeq or NextSeq platform to obtain at least 20 million reads per sample.
Key Quantitative Data in ChIP-seq
Table 1: Typical ChIP-seq Experimental Parameters and QC Metrics
| Parameter / Metric | Typical Range or Target Value | Purpose / Implication |
|---|---|---|
| Crosslinking Time | 8-12 minutes (formaldehyde) | Balances crosslinking efficiency with epitope masking. |
| Sonication Fragment Size | 200-500 bp | Optimal for resolution and NGS library prep. |
| Antibody Amount | 1-10 µg per IP | Must be titrated for specificity and signal-to-noise. |
| Sequencing Depth | 20-50 million reads (TF) 40-80 million reads (histone mark) | Ensures sufficient coverage for peak calling. |
| % of Reads in Peaks (FRiP) | >1% (TF) >10-30% (histone marks) | Key QC metric for enrichment success. |
| Peak Number (Mammalian Genome) | 10,000 - 80,000 (TF) 50,000 - 200,000+ (broad marks) | Varies by factor, cell type, and statistical threshold. |
The Scientist's Toolkit: Research Reagent Solutions
Table 2: Essential Materials for a ChIP-seq Experiment
| Item | Function & Critical Notes |
|---|---|
| Specific, Validated Antibody | The most critical reagent. Must be validated for ChIP (ChIP-seq grade). Targets TF, co-factor, or histone modification. |
| Protein A/G Magnetic Beads | For efficient capture of antibody-bound complexes. Magnetic beads simplify wash steps. |
| Formaldehyde (37%) | Reversible crosslinker to fix protein-DNA interactions. |
| Protease Inhibitor Cocktail | Prevents degradation of the target protein and chromatin during lysis and IP. |
| Covaris Focused-Ultrasonicator | Provides consistent, controllable acoustic shearing for chromatin fragmentation. |
| SPRI (Solid Phase Reversible Immobilization) Beads | Used for DNA clean-up and size selection throughout library prep (faster, safer than phenol-chloroform). |
| Commercial ChIP-seq Library Prep Kit | (e.g., NEBNext Ultra II). Standardized, efficient reagents for end-prep, ligation, and amplification. |
| Dual-Indexed Adapters | Allow multiplexing of many samples in a single sequencing run. |
| High-Fidelity DNA Polymerase | For limited-cycle PCR amplification of libraries to minimize bias and errors. |
| Bioanalyzer/TapeStation | Capillary electrophoresis system for accurate sizing and quantification of libraries before sequencing. |
Visualized Workflow and Analysis
Diagram 1: ChIP-seq Experimental and Computational Workflow
Diagram 2: Parallel Processing of ChIP and Control Samples
Diagram 3: Computational Analysis Pipeline for ChIP-seq Data
Within the framework of ChIP-seq research aimed at elucidating transcription factor (TF) binding mechanisms, the accurate interpretation of key outputs is fundamental. This technical guide provides an in-depth analysis of core terminology—peaks, motifs, and binding profiles—and their interconnected roles in transforming raw sequencing data into mechanistic biological insights. These concepts form the analytical bedrock for discovery in gene regulation, chromatin biology, and targeted therapeutic development.
Core Terminology and Analytical Outputs
Peaks
Peaks represent genomic regions enriched with aligned sequencing reads, signifying potential protein-DNA interaction sites. They are the primary direct output of ChIP-seq data analysis.
Table 1: Common Peak-Calling Algorithms and Key Metrics
| Algorithm | Primary Statistical Method | Key Output Metric | Optimal Use Case |
|---|---|---|---|
| MACS2 (v2.2.7.1) | Empirical Bayesian estimation, Poisson distribution | FDR (False Discovery Rate), p-value | Broad & narrow peaks, general TF ChIP-seq |
| SICER2 | Spatial clustering approach | FRIP (Fraction of Reads in Peaks) | Broad histone marks (H3K27me3, H3K36me3) |
| HOMER (findPeaks) | Binomial distribution, local tag density | Fold-enrichment over local background | Promoter-focused & precise TF binding |
| GEM | Multivariate learning (Binomial + DNA shape) | Recognition Potential Score | High-resolution TF motif discovery within peaks |
Motifs
Motifs are short, conserved DNA sequence patterns within peaks that represent the sequence-specific binding preference of the target TF or its cooperative partners. De novo motif discovery identifies overrepresented sequences, while motif scanning matches known patterns from databases like JASPAR or CIS-BP.
Table 2: Quantitative Metrics for Motif Analysis
| Metric | Definition | Typical Range (Strong Match) | Interpretation |
|---|---|---|---|
| p-value | Significance of motif enrichment | 1e-10 to 1e-50 | Lower value indicates higher enrichment |
| E-value | Expected number of motifs with same score | < 0.01 | Corrects for database size; lower is better |
| q-value (FDR) | Adjusted p-value for multiple testing | < 0.05 | Statistically significant motif discovery |
| Position Weight Matrix (PWM) Score | Log-likelihood ratio of the sequence | Varies by TF | Higher score indicates stronger match to consensus |
| Information Content (IC) | Bit score measuring motif specificity | 8-16 bits | Higher IC indicates more conserved, informative positions |
Binding Profiles
A binding profile integrates peak location, motif occurrence, and signal intensity across the genome to characterize the TF's binding landscape. Key aspects include:
- Spatial Distribution: Promoter-proximal vs. enhancer-distal binding.
- Signal Shape: Sharp peaks for TFs vs. broad domains for histone marks.
- Co-localization: Overlap with other epigenetic marks (e.g., H3K27ac for active enhancers).
- Functional Association: Correlation with gene expression changes (from RNA-seq).
Table 3: Components of an Integrated TF Binding Profile
| Component | Data Source | Measurement | Biological Insight |
|---|---|---|---|
| Peak Intensity | ChIP-seq read depth | Normalized Read Counts (e.g., RPKM, CPM) | Relative binding strength |
| Motif Position | De novo discovery/scanning | Distance from peak summit (bp) | Direct vs. indirect binding |
| Chromatin State | Public/parallel ChIP-seq | Overlap with annotated chromatin states | Active/poised/repressed regulatory element |
| Gene Linkage | Genomic annotation | Distance to TSS (Transcription Start Site) | Target gene prediction |
| Conservation | PhyloP/PHAST scores | Evolutionary conservation score | Functional constraint |
Experimental Protocols for Key Methodologies
Standard ChIP-seq Wet-Lab Protocol
Principle: Crosslink protein to DNA, immunoprecipitate with specific antibody, sequence bound fragments.
- Crosslinking: Treat cells with 1% formaldehyde for 10 min at room temperature. Quench with 125 mM glycine.
- Cell Lysis & Sonication: Lyse cells. Sonicate chromatin to fragment size of 200-500 bp. Verify fragmentation via agarose gel electrophoresis.
- Immunoprecipitation (IP): Incubate lysate with 2-5 µg of validated, target-specific antibody overnight at 4°C. Use Protein A/G beads for capture.
- Wash & Elute: Wash beads stringently (e.g., low salt, high salt, LiCl washes). Elute complexes in 1% SDS, 100 mM NaHCO3.
- Reverse Crosslinks & Purify: Incubate at 65°C overnight. Treat with RNase A and Proteinase K. Purify DNA using silica columns.
- Library Prep & Sequencing: Use commercial kit (e.g., Illumina). Sequence on appropriate platform (e.g., NovaSeq) to achieve >10 million non-redundant mapped reads for TFs.
Computational Workflow for Peak & Motif Analysis
Principle: Transform raw FASTQ files into annotated binding sites.
- Quality Control & Alignment: Use FastQC. Trim adapters with Trimmomatic. Align reads to reference genome (e.g., hg38) using Bowtie2 or BWA. Remove duplicates (Picard).
- Peak Calling: For TFs, use MACS2:
macs2 callpeak -t treatment.bam -c control.bam -f BAM -g hs -n output --outdir . -q 0.05. - Motif Discovery: Use HOMER:
findMotifsGenome.pl peaks.bed hg38 output_dir -size 200 -mask. Or use MEME-ChIP on peak summit sequences. - Binding Profile Generation: Generate bigWig files for visualization (deepTools bamCoverage). Annotate peaks relative to genes (ChIPseeker in R). Integrate with RNA-seq data.
Visualizing the Analytical Pathway
Title: ChIP-seq Data Analysis Workflow from Reads to Insight
The Scientist's Toolkit: Research Reagent Solutions
Table 4: Essential Materials for ChIP-seq Experiments
| Item | Function | Example Product/Kit |
|---|---|---|
| Validated ChIP-grade Antibody | Specifically immunoprecipitates the target protein. Critical for success. | Cell Signaling Technology, Active Motif, Diagenode |
| Magnetic Protein A/G Beads | Efficient capture of antibody-protein-DNA complexes. | Dynabeads (Thermo Fisher) |
| Sonicator | Shears chromatin to optimal fragment size. | Covaris S220, Bioruptor Pico (Diagenode) |
| Crosslinking Reagent | Covalently stabilizes protein-DNA interactions. | Formaldehyde (37%), DSG (Disuccinimidyl Glutarate) for dual crosslinking |
| DNA Purification Kit | Clean recovery of immunoprecipitated DNA post-elution. | QIAquick PCR Purification Kit (Qiagen), ChIP DNA Clean & Concentrator (Zymo) |
| High-Sensitivity DNA Assay | Accurately quantifies low-yield ChIP DNA for library prep. | Qubit dsDNA HS Assay Kit (Thermo Fisher) |
| Library Preparation Kit | Prepares sequencing libraries from low-input DNA. | KAPA HyperPrep Kit (Roche), NEBNext Ultra II DNA (NEB) |
| SPRI Beads | Size selection and clean-up of DNA fragments. | AMPure XP Beads (Beckman Coulter) |
| Positive Control Primer Set | Validates ChIP efficiency at a known binding site. | Human GAPDH Promoter Primers, rRNA Promoter Primers |
| Negative Control IgG | Assesses non-specific background binding. | Species-matched Normal IgG |
From Profiles to Mechanism: A Pathway View
Title: Mechanistic Pathway from TF Binding to Gene Activation
The systematic dissection of peaks, motifs, and binding profiles is indispensable for advancing the central thesis of ChIP-seq in transcription factor research. By rigorously applying the described experimental and computational protocols, and interpreting outputs within the integrated framework visualized, researchers can move beyond mere cataloging of binding events towards a predictive, mechanistic understanding of gene regulation. This forms a critical foundation for identifying novel therapeutic targets and modulating transcriptional programs in disease.
The Critical Role of Antibody Specificity and Chromatin Quality in Foundational Success
Within chromatin immunoprecipitation followed by sequencing (ChIP-seq), the foundational success of any experiment aimed at discovering transcription factor (TF) binding mechanisms hinges on two pillars: the absolute specificity of the immunoprecipitation antibody and the structural integrity of the input chromatin. Compromises in either parameter propagate through the workflow, generating artifactual data that misrepresents the protein-DNA interactome, ultimately derailing downstream mechanistic insights and therapeutic target validation in drug development.
The Dual Pillars: A Technical Deconstruction
Antibody Specificity: The Primary Determinant of Signal-to-Noise
A ChIP-grade antibody must demonstrate high affinity and exclusive selectivity for its target epitope in the context of cross-linked, sheared chromatin. Non-specific binding or off-target recognition is a primary source of false-positive peaks.
Table 1: Quantitative Metrics for Validating ChIP-Seq Antibody Specificity
| Validation Assay | Optimal Metric/Result | Acceptable Threshold | Consequence of Failure |
|---|---|---|---|
| Knockout/Knockdown Validation | >95% reduction in ChIP signal | >80% reduction | High false-positive rate; uninterpretable binding profiles. |
| Immunoblot (Whole Cell Lysate) | Single band at correct MW. | Minor secondary bands acceptable only if explained. | Off-target pulldown of unrelated proteins/DNA regions. |
| Peptide Blocking Competition | >90% signal ablation with target peptide; <10% with control peptide. | >70% specific ablation. | Indicates antibody affinity is not epitope-specific. |
| IP-Mass Spectrometry | Target protein as top enriched hit; minimal unrelated factors. | Target protein in top 3 hits with high peptide count. | Reveals unknown cross-reactivity not apparent in other assays. |
Protocol: Knockout/Knockdown Validation for Antibody Specificity
- Cell Line Generation: Create an isogenic pair: wild-type (WT) and target transcription factor knockout (KO) cells using CRISPR-Cas9 or stable shRNA knockdown.
- Parallel ChIP: Perform ChIP-seq in parallel on WT and KO cells using the same antibody lot, chromatin input amount (e.g., 10 µg), and library preparation kit.
- Quantitative PCR (qPCR): Before sequencing, assay known positive and negative genomic control regions. The signal at positive controls should be abolished in KO cells.
- Sequencing & Analysis: Sequence libraries to a moderate depth (~20 million reads). Compare peak calls: >95% of peaks called in WT should be absent in the KO sample. Residual peaks in the KO indicate non-specific binding.
Chromatin Quality: Preserving Native Biological State
Chromatin quality encompasses fixation efficiency, fragmentation uniformity, and the preservation of protein-DNA and protein-protein interactions. Over-fixation masks epitopes and reduces shearing efficiency; under-fixation fails to capture transient interactions.
Table 2: Quantitative Parameters for Assessing Chromatin Quality
| Parameter | Optimal Range | Measurement Method | Impact on ChIP-seq Outcome |
|---|---|---|---|
| Fragment Size Distribution | 100-500 bp, peak ~200-300 bp. | Bioanalyzer/TapeStation. | Defines resolution; large fragments reduce mapping precision. |
| Cross-linking Duration | 5-15 min (1% formaldehyde). | Empirical testing for each cell/TF. | Over-fixation: epitope masking, poor shearing. Under-fixation: loss of weak interactions. |
| Sonication Efficiency | >90% fragments in target range. | Post-sonication gel electrophoresis. | Inefficient shearing yields low signal and high background. |
| Chromatin Concentration | 50-200 ng/µL. | Fluorometric assay (Qubit). | Low concentration compromises IP efficiency and necessitates scaling. |
Protocol: Optimized Chromatin Preparation for TF ChIP-seq
- Formaldehyde Cross-linking: Treat cells with 1% final concentration of high-purity formaldehyde for 10 minutes at room temperature with gentle agitation.
- Quenching: Add glycine to 125 mM final concentration, incubate 5 min.
- Cell Lysis: Wash cells, resuspend in cold cell lysis buffer (10 mM Tris-HCl pH 8.0, 10 mM NaCl, 0.2% NP-40 + protease inhibitors). Incubate on ice 15 min, pellet nuclei.
- Nuclear Lysis & Sonication: Resuspend nuclei in sonication buffer (50 mM Tris-HCl pH 8.0, 10 mM EDTA, 1% SDS). Sonicate using a focused ultrasonicator (e.g., Covaris) for optimized cycles (e.g., 12 cycles of 30 sec ON/30 sec OFF, peak power 140W) to achieve 200-500 bp fragments. Keep samples at 4°C.
- Chromatin Clarification: Centrifuge sonicated lysate at 20,000 x g for 10 min at 4°C. Transfer supernatant (soluble chromatin) to a new tube. Quantify DNA concentration and assess fragment size profile.
Integrated Experimental Workflow
The synergy between antibody specificity and chromatin quality is realized in a meticulously controlled experimental pipeline.
The Scientist's Toolkit: Research Reagent Solutions
Table 3: Essential Research Reagents for Robust ChIP-seq
| Reagent Category | Specific Product/Type | Critical Function |
|---|---|---|
| Validated Antibodies | CRISPR-validated monoclonal antibodies (e.g., from ENCODE projects). | Ensure target specificity; minimize off-target peak calling. |
| Magnetic Beads | Protein A/G magnetic beads with low non-specific DNA binding. | Facilitate efficient pulldown and clean washes; reduce background. |
| Cross-linker | Ultra-pure formaldehyde (Methanol-free). | Standardizes fixation; methanol contaminants can affect epitopes. |
| Sonication System | Focused ultrasonicator (e.g., Covaris, Bioruptor). | Provides consistent, controllable shearing for uniform fragment sizes. |
| Chromatin QC Kit | High-sensitivity DNA assay (e.g., Qubit dsDNA HS) and fragment analyzer (e.g., Agilent Bioanalyzer High Sensitivity DNA kit). | Accurately quantifies dilute chromatin and visualizes fragment distribution. |
| Library Prep Kit | ThruPLEX DNA-seq or NEBNext Ultra II DNA Library Prep. | Optimized for low-input, fragmented ChIP DNA; maintains complexity. |
| SPRI Beads | AMPure XP or equivalent. | For post-sonication cleanup and library size selection. |
| Positive Control Primer Set | qPCR primers for a known, strong binding site of the TF. | Essential for experimental troubleshooting and normalization. |
| Negative Control Primer Set | qPCR primers for a genomic region devoid of binding (e.g., gene desert). | Quantifies non-specific background signal. |
Data Interpretation & The Path to Discovery
High-quality data derived from stringent protocols enables accurate mechanistic inference.
In the framework of ChIP-seq research for TF binding discovery, foundational success is non-negotiable and is defined by rigorous, quantitative validation of antibody specificity and chromatin integrity. These factors are not mere technical details but are the core determinants of data fidelity. For drug development professionals relying on these datasets to nominate therapeutic targets, investment in these foundational elements is the critical first step in de-risking the entire translational pipeline.
From Theory to Discovery: Advanced ChIP-seq Protocols and Cutting-Edge Applications
Within the broader thesis on elucidating transcription factor (TF) binding mechanisms via ChIP-seq, the robustness of any conclusion is dictated by the foundational experimental design. This technical guide details the three essential pillars—controls, replicates, and sequencing depth—that ensure biological and technical validity, enabling accurate de novo motif discovery, binding site identification, and mechanistic insight into gene regulation.
The Critical Role of Controls
Appropriate controls are mandatory to distinguish specific TF binding from background noise.
2.1. Types of Essential Controls
- IgG or Non-Specific Antibody Control: Identifies regions enriched due to non-specific antibody binding or open chromatin.
- Input DNA Control: Accounts for genomic regions susceptible to sonication and sequencing biases (e.g., high GC content, open chromatin). It is the minimum required control for peak calling.
- Negative Cell/Tissue Control: A cell line or condition lacking the TF of interest validates antibody specificity.
- Competition Control (Peptide Block): Pre-incubation of the antibody with its target antigen peptide should abolish specific signals.
- Positive Control Region: Validation via qPCR at a known binding site confirms successful immunoprecipitation.
2.2. Experimental Protocol: Input DNA Preparation
- Parallel Processing: Reserve 1% (v/v) of the sonicated chromatin before immunoprecipitation.
- Reverse Cross-linking: Add NaCl to a final concentration of 200 mM and incubate at 65°C for 4-6 hours (or overnight).
- Digestion: Add RNase A (final 0.2 mg/mL) and incubate at 37°C for 30 min.
- Protein Digestion: Add Proteinase K (final 0.2 mg/mL) and incubate at 55°C for 1-2 hours.
- Purification: Purify DNA using a PCR purification kit or phenol-chloroform extraction. Elute in 10-50 µL of TE buffer or nuclease-free water.
Replicates: Ensuring Statistical Rigor
Replicates address biological variability and technical noise. Current best practices, as emphasized by consortia like ENCODE, mandate biological replicates.
3.1. Replicate Strategy & Analysis
Table 1: Replicate Design and Consensus Peak Identification
| Replicate Type | Definition | Minimum Recommended Number | Primary Purpose | Typical Agreement Threshold (IDR) |
|---|---|---|---|---|
| Biological | Independently grown and processed cell populations. | 2-3 | Capture biological variation and ensure reproducibility. | Irreproducible Discovery Rate (IDR) < 0.05 (5%) for 2 replicates. |
| Technical | Aliquots of the same biological sample processed separately. | 1-2 (optional) | Assess technical variability from library prep/sequencing. | High correlation (Pearson's r > 0.9). |
3.2. Experimental Protocol: Irreproducible Discovery Rate (IDR) Analysis IDR is the gold standard for assessing reproducibility between two replicates.
- Peak Calling: Call peaks on each replicate individually and on the pooled reads using a peak caller (e.g., MACS2).
- Rank Peaks: For each replicate set, rank peaks by statistical significance (e.g., -log10(p-value)).
- Calculate IDR: Use the
idrpackage (https://github.com/nboley/idr). - Filter Peaks: Retain peaks passing a chosen IDR threshold (e.g., ≤ 0.05) as the high-confidence set.
Sequencing Depth: Determining Coverage
Sufficient depth is required to saturate the detection of binding sites.
4.1. Guidelines and Saturation Analysis
Table 2: Recommended Sequencing Depth for ChIP-seq Experiments
| Target Type | Recommended Reads (Mapped) | Rationale |
|---|---|---|
| Narrow Peak TF (e.g., p53) | 20-50 million reads per replicate. | Defined, punctate binding sites require less depth for saturation. |
| Broad Histone Mark (e.g., H3K27me3) | 40-60 million reads per replicate. | Broad domains require more reads to define boundaries accurately. |
| Pilot Experiment / Saturation Test | 10-15 million reads. | To model saturation and determine optimal depth for full experiment. |
4.2. Experimental Protocol: Sequencing Saturation Analysis
- Subsample Reads: Randomly subsample your full sequencing dataset at increasing fractions (e.g., 10%, 20%, ...100%) using
seqtk. - Peak Calling: Call peaks on each subsampled BAM file using consistent parameters.
- Plot Saturation: Plot the number of peaks identified (or fraction of peaks from the full dataset) against the number of sequenced reads. The point where the curve plateaus indicates adequate sequencing depth.
The Scientist's Toolkit: Research Reagent Solutions
Table 3: Essential Materials for Robust ChIP-seq Experiments
| Item | Function & Importance |
|---|---|
| Crosslinking Agent (e.g., 1% Formaldehyde) | Fixes protein-DNA interactions in vivo, capturing transient binding events. |
| Chromatin Shearing Apparatus (Covaris or Bioruptor) | Provides consistent, reproducible sonication to fragment chromatin to 200-600 bp. |
| Validated ChIP-Grade Antibody | The single most critical reagent. Must be validated for specificity and efficacy in ChIP. |
| Magnetic Protein A/G Beads | Efficient capture of antibody-bound complexes, enabling low-background purification. |
| High-Fidelity Library Prep Kit (e.g., NEB Next Ultra II) | Minimizes PCR duplicates and biases during sequencing library construction. |
| Dual-Indexed Adapters | Allow multiplexing of samples, reducing batch effects and sequencing cost. |
| Spike-in Control DNA (e.g., D. melanogaster chromatin) | Normalizes for technical variation (cell count, IP efficiency) across samples. |
| Qubit Fluorometer & High-Sensitivity DNA Assay | Accurate quantification of low-concentration ChIP DNA for library prep. |
Visualizing Experimental Workflow and Logic
Title: ChIP-seq Experimental Design and Analysis Workflow
Title: Replicate Logic and IDR Analysis for Peak Confidence
Chromatin Immunoprecipitation followed by sequencing (ChIP-seq) is the cornerstone experimental technique for identifying genome-wide transcription factor (TF) binding sites, a critical component for understanding gene regulatory networks in development, disease, and drug response. The interpretation of these experiments hinges entirely on a robust, multi-step computational pipeline. This technical guide deconstructs the core bioinformatic workflow—read alignment, peak calling, and quality assessment—within the framework of mechanistic research into TF binding.
Read Alignment: Mapping Signals to the Genome
The primary data from a ChIP-seq experiment are short nucleotide sequences (reads) representing fragments of bound DNA. The first computational step is to map these reads to a reference genome.
Experimental Protocol (Key Steps for Alignment):
- Quality Control & Trimming: Assess raw FASTQ files using FastQC. Use Trimmomatic or Cutadapt to remove adapter sequences and low-quality bases (typical Phred score threshold: <20).
- Alignment Algorithm Selection: Choose an aligner suitable for short reads with high speed and accuracy, such as BWA-MEM or Bowtie2.
- Alignment Execution: Run the aligner with parameters tuned for ChIP-seq. For Bowtie2, a common command is:
bowtie2 -x <indexed_genome> -U <input.fastq> -S <output.sam> --local --very-sensitive - Post-Processing: Convert SAM to BAM, sort, and index using SAMtools. Remove PCR duplicates using Picard Tools or SAMtools to prevent artificial inflation of signal.
Table 1: Comparison of Common Short-Read Aligners for ChIP-seq
| Tool | Algorithm Core | Speed | Memory | Key Consideration for ChIP-seq |
|---|---|---|---|---|
| Bowtie2 | FM-index, Burrows-Wheeler Transform | High | Moderate | Excellent balance of speed and sensitivity; --local mode handles indels. |
| BWA-MEM | FM-index, Burrows-Wheeler Transform | High | Moderate | Similar performance to Bowtie2; often preferred for variant calling. |
| STAR | Spliced Alignment | Moderate | High | Designed for RNA-seq; not typically used for standard ChIP-seq. |
Peak Calling: Identifying Significant Binding Sites
Peak calling is the process of identifying genomic regions with a statistically significant enrichment of mapped reads compared to a background model, distinguishing true TF binding events from noise.
Experimental Protocol (Peak Calling with MACS2):
- Input Preparation: Have your treatment BAM file (TF ChIP) and a control/input BAM file (no antibody or IgG).
- Call Peaks: Run MACS2 with key parameters.
macs2 callpeak -t treatment.bam -c control.bam -f BAM -g hs -n experiment_name --outdir peaks --qvalue 0.05 --broad-g: Effective genome size (e.g.,hsfor human).--qvalue: Minimum FDR cutoff (e.g., 0.05).--broad: Use for histone marks or broad domains; omit for sharp TF peaks.
- Output Interpretation: The primary output (
experiment_name_peaks.narrowPeak) contains genomic coordinates, peak height (signal value), and statistical significance.
Table 2: Common Peak Callers and Their Applications
| Tool | Primary Use Case | Statistical Model | Key Feature |
|---|---|---|---|
| MACS2 | Sharp TF peaks & broad domains | Poisson distribution | Widely adopted, robust, provides both narrow and broad peak calling. |
| HOMER | TF and histone modification peaks | Binomial distribution | Integrated suite for peak calling and motif discovery. |
| SEACR | Sparse or sensitive data (e.g., CUT&Tag) | AUC-based thresholding | Non-parametric, performs well with low-background data. |
| SPP | TF peaks, especially for older data | Z-score based | Less sensitive to background noise structure. |
Rigorous quality control is non-negotiable. Poor-quality data can lead to false discovery and invalid mechanistic insights.
Table 3: Essential ChIP-seq Quality Metrics
| Metric | Tool for Assessment | Optimal Range (TF ChIP-seq) | Biological Interpretation |
|---|---|---|---|
| PCR Bottleneck Coefficient (PBC) | phantompeakqualtools |
PBC1 > 0.9 | Measures library complexity. Low complexity suggests excessive PCR duplication. |
| Fraction of Reads in Peaks (FRiP) | featureCounts or MACS2 |
> 1% (TF), > 20% (Histone) | Signal-to-noise ratio. Low FRiP indicates poor enrichment. |
| Cross-Correlation (NSC/ RSC) | phantompeakqualtools |
NSC > 1.05, RSC > 0.8 | Assesses fragment length estimation and signal sharpness. |
| Peak Distribution Relative to TSS | HOMER annotatePeaks.pl |
High enrichment near TSS | Confirms biological validity; true TF peaks often cluster near transcription start sites. |
The Scientist's Toolkit: Key Research Reagent Solutions
| Category | Item/Reagent | Function in ChIP-seq Experiment |
|---|---|---|
| Antibody | High-Specificity Primary Antibody | Immunoprecipitates the target TF or histone modification. The single most critical reagent. |
| Magnetic Beads | Protein A/G Magnetic Beads | Binds antibody-TF-DNA complex for separation and washing. |
| Library Prep Kit | Commercial ChIP-seq Library Kit | Standardizes end-repair, A-tailing, adapter ligation, and PCR amplification. |
| Control | Sheared Input Genomic DNA | Serves as the background control for peak calling. |
| Validation | qPCR Primers for Known Sites | Confirms enrichment at positive control regions post-IP, prior to sequencing. |
| Cell Fixation | Formaldehyde | Crosslinks proteins to DNA to preserve in vivo binding interactions. |
A meticulously executed bioinformatics pipeline transforms raw sequencing data into a reliable map of transcription factor occupancy. Within the thesis of discovering TF binding mechanisms, each step—from rigorous alignment and statistically sound peak calling to stringent quality metrics—builds a foundation for downstream analyses like motif discovery, pathway enrichment, and integrative genomics. This framework enables researchers and drug developers to confidently link TF binding events to regulatory circuits driving disease states, identifying potential therapeutic targets.
Chromatin Immunoprecipitation followed by sequencing (ChIP-seq) is the cornerstone for identifying genome-wide transcription factor (TF) binding sites. The broader thesis of this research is to elucidate the cis-regulatory code governing gene expression. While ChIP-seq identifies bound genomic regions, the precise DNA sequence motifs that define TF binding specificity remain obscured within these peaks. De novo motif discovery and subsequent enrichment analysis are thus critical, computational steps to decode this binding lexicon, moving from genomic coordinates to mechanistic understanding of transcriptional regulation.
The Experimental and Computational Workflow
The process from ChIP-seq data to validated binding motifs is a multi-stage pipeline.
Figure 1: From ChIP-seq data to mechanistic insight.
Core Tools forDe NovoMotif Discovery
These algorithms identify overrepresented sequence patterns within peak regions without prior knowledge.
MEME-ChIP Suite:
- MEME: Discovers ungapped, recurring motifs using expectation-maximization.
- DREME: Designed for eukaryotic DNA, finds short, core motifs rapidly.
- CentriMo: Identifies motifs centrally enriched in peak regions.
HOMER:
findMotifsGenome.pl: A comprehensive command that performs sequence extraction, de novo discovery, and enrichment against background sequences in one step.
STREME:
- A modern, faster alternative to DREME, providing accurate p-values and controlling for sequence composition bias.
Table 1: Comparison of Primary de novo Discovery Tools
| Tool | Core Algorithm | Best For | Key Output |
|---|---|---|---|
| MEME-ChIP | EM, Differential Enrichment | Comprehensive analysis, expert users | HTML report, PWMs |
| HOMER | Hypergeometric/Odds Ratio | Integrated workflow, beginners | Known & novel motifs, paths to files |
| STREME | Suffix Tree, Fisher's Exact | Speed, large datasets, unbiased | Multiple motif formats, Tomtom input |
Detailed Protocol: A StandardDe NovoWorkflow Using HOMER
Objective: To discover motifs enriched in a set of ChIP-seq peaks.
Input: A BED file of high-confidence peaks (peaks.bed) and the reference genome assembly (e.g., hg38).
Procedure:
- Install HOMER: Follow instructions at http://homer.ucsd.edu/homer/.
- Load Genomic Data: Run
perl /path/to/homer/configureHomer.pl -install hg38. - Execute Motif Discovery:
peaks.bed: Input peak file.hg38: Reference genome../output_dir: Output directory.-size 200: Analyze sequence from -100 to +100 bp around peak center.-p 8: Use 8 processor cores.
Output Interpretation: The main result is homerResults.html and homerMotifs.all.motifs. The HTML file ranks motifs by statistical enrichment (p-value), showing logos, best match to known databases, and genomic location enrichment.
Strategies for Enrichment Analysis and Validation
De novo discovery yields candidate motifs; enrichment analysis contextualizes them.
1. Comparative Enrichment: Motifs are tested for enrichment in the target peak set versus a matched background (e.g., input DNA, flanking regions, shuffled peaks). Tools like HOMER and MEME-ChIP perform this intrinsically.
2. Database Comparison: Novel motifs are compared to known motifs in databases like JASPAR, CIS-BP, or TRANSFAC using tools like Tomtom. This identifies potential TF families.
Figure 2: Validating novel motifs against known databases.
3. Functional Enrichment Correlation: Integrate with RNA-seq data. Are genes near peaks containing a specific motif differentially expressed upon TF perturbation?
4. Experimental Validation: Essential for confirming bioinformatic predictions (see Toolkit).
Table 2: Key Databases for Motif Comparison & Enrichment
| Database | Scope | Key Feature | URL |
|---|---|---|---|
| JASPAR | Curated, non-redundant | Open-access, high-quality models | jaspar.genereg.net |
| CIS-BP | Extensive, inferred | Includes motifs for many TFs via DBD similarity | cisbp.ccbr.utoronto.ca |
| HOCOMOCO | Human/Mouse focused | Models built from comprehensive ChIP-seq data | hocomoco11.autosome.ru |
| MEME Suite DB | Aggregated | Collection of multiple public databases | meme-suite.org/meme/db |
The Scientist's Toolkit: Essential Research Reagents & Materials
Table 3: Key Reagent Solutions for Experimental Validation of Predicted Motifs
| Item | Function & Application | Example/Format |
|---|---|---|
| Anti-FLAG M2 Affinity Gel | Immunoprecipitation of epitope-tagged transcription factors in ChIP-validation experiments. | Agarose beads, Sigma A2220 |
| Poly(dI·dC) | Non-specific competitor DNA to reduce background in Electrophoretic Mobility Shift Assays (EMSAs). | Liquid solution, Sigma P4929 |
| Biotin 3' End DNA Labeling Kit | Labels oligonucleotide probes containing the predicted motif for non-radioactive EMSA or Southwestern blot. | Kit, Thermo Fisher 89818 |
| Dynabeads M-280 Streptavidin | Pull-down of biotinylated DNA probes in DNA pull-down/protein interaction assays. | Magnetic beads, Invitrogen 11205D |
| Dual-Luciferase Reporter Assay System | Quantifies the transcriptional activity of a predicted motif cloned upstream of a minimal promoter. | Kit, Promega E1910 |
| SITE-Seq/MITOMI Libraries | High-throughput in vitro binding assays to measure affinity of TF for thousands of motif variants. | Custom synthesized oligo pools |
| PCR Purification & Gel Extraction Kits | Essential for cleaning DNA fragments for cloning reporter constructs or probes. | Kit, Qiagen 28104/28704 |
| Competent Cells (High Efficiency) | For cloning plasmid constructs containing wild-type/mutated motifs for reporter assays. | Cells, NEB C2987H |
This whitepaper serves as a core technical chapter within a broader thesis investigating transcription factor (TF) binding mechanisms via ChIP-seq. While ChIP-seq precisely maps TF occupancy, binding events alone are insufficient to predict functional outcomes on gene regulation. Integrative genomics provides the critical framework to correlate these binding events with downstream transcriptional activity (via RNA-seq) and the regulatory chromatin context (via epigenetic marks). This correlation is essential to distinguish functional, regulatory binding from inert, non-functional occupancy, thereby advancing the thesis from mere binding site discovery to mechanistic understanding of transcriptional control.
Foundational Concepts and Data Types
A robust integrative analysis hinges on the precise generation and interpretation of multi-modal genomic datasets. The core data types and their quantitative outputs are summarized below.
Table 1: Core Genomic Assays for Integrative Analysis
| Assay | Primary Output | Key Quantitative Metrics | Functional Interpretation |
|---|---|---|---|
| ChIP-seq | Genome-wide binding sites (peaks) | Peak count, peak score (-log10 p-value), read depth, FRiP (Fraction of Reads in Peaks) | Direct mapping of TF occupancy or histone mark localization. |
| RNA-seq | Transcript abundance | FPKM/TPM (expression level), differential expression (log2 fold change, adjusted p-value) | Measurement of gene expression output and changes. |
| ATAC-seq | Regions of open chromatin | Peak count, insertion size distribution, TSS enrichment score | Inference of chromatin accessibility and regulatory potential. |
| ChIP-seq (Histone Marks) | Epigenomic landscape | Signal intensity over genomic regions (e.g., promoters, enhancers) | Definition of regulatory states (e.g., H3K4me3 for active promoters, H3K27ac for active enhancers). |
Detailed Experimental Protocols
Integrated Workflow for Sample Preparation
A successful correlation study begins with coordinated experimental design.
- Cell/Tissue Source: Use biologically matched samples for all assays (ChIP-seq, RNA-seq, epigenetic profiling). Technical and biological replicates (n ≥ 3) are mandatory for statistical rigor.
- Cross-linking for ChIP-seq: Treat cells with 1% formaldehyde for 8-12 minutes at room temperature. Quench with 125mM glycine.
- Nuclear Isolation & Chromatin Shearing: Isolate nuclei using a hypotonic buffer. Shear chromatin via sonication (e.g., Covaris M220) to achieve a fragment size distribution of 200-500 bp. Verify fragmentation using an Agilent Bioanalyzer.
- Immunoprecipitation (ChIP): Incubate sheared chromatin with a validated, high-specificity antibody against the target TF or histone mark. Use magnetic protein A/G beads for capture. Wash stringently (e.g., high-salt, LiCl washes). Reverse crosslinks and purify DNA.
- RNA Extraction & Library Prep (RNA-seq): Extract total RNA in parallel using TRIzol. Perform poly-A selection or rRNA depletion. Prepare stranded cDNA libraries.
- Library Preparation & Sequencing: Prepare sequencing libraries for all assays using compatible kits (e.g., Illumina). Sequence on a platform like NovaSeq 6000 to a recommended depth:
- TF ChIP-seq: 20-50 million reads.
- Histone Mark ChIP-seq: 30-60 million reads.
- RNA-seq: 30-50 million reads.
- ATAC-seq: 50-100 million reads.
Core Computational & Statistical Correlation Protocol
- Data Processing: Align all sequencing reads to the reference genome (e.g., hg38) using optimized aligners (BWA for ChIP-seq, STAR for RNA-seq). Call peaks for ChIP/ATAC-seq using MACS2 or similar.
- Peak Annotation & Assignment: Annotate TF binding peaks to nearest genes or putative target genes using tools like ChIPseeker or HOMER, considering distance and chromatin interaction data (Hi-C) if available.
- Correlation Analysis:
- Quantification: For each gene, create a data vector: TF binding signal (peak score/read count in promoter/enhancer), RNA-seq expression (TPM), and epigenetic signal intensity.
- Binning & Stratification: Stratify genes based on TF binding (bound vs. unbound) or epigenetic context (e.g., high vs. low H3K27ac). Compare expression distributions between strata using non-parametric tests (Mann-Whitney U).
- Regression Modeling: Perform multivariate regression (e.g.,
Expression ~ TF_Signal + H3K4me3 + H3K27ac + Accessibility) to model the relative contribution of each factor. - Causal Inference: Apply tools like MAGGIE (Multiscale Analysis of Genomic and Gene-regulatory Interactions) to infer potential causality by integrating TF perturbation data (e.g., siRNA knockdown followed by RNA-seq).
Visualizing Integrative Relationships
Title: Integrative Genomics Analysis Workflow
Title: Hierarchical Model of Transcriptional Activation
The Scientist's Toolkit: Key Research Reagent Solutions
Table 2: Essential Reagents and Tools for Integrated TF Studies
| Item | Function & Rationale |
|---|---|
| High-Specificity ChIP-grade Antibodies | Validated for immunoprecipitation under cross-linked conditions. Critical for low-noise TF and histone mark data (e.g., Cell Signaling Technology, Abcam). |
| Magnetic Protein A/G Beads | Efficient capture of antibody-chromatin complexes, enabling stringent washing and reduced background. |
| Covaris AFA Ultrasonicator | Provides consistent, tunable chromatin shearing to optimal fragment sizes for high-resolution peak calling. |
| TRIzol/RNA Clean-up Kits | Maintains RNA integrity for accurate expression profiling, especially for low-abundance transcripts. |
| Stranded RNA Library Prep Kit | Preserves strand information, crucial for discerning overlapping transcripts and antisense regulation. |
| AMPure XP Beads | Provides consistent size selection and cleanup for DNA libraries across all assay types. |
| Validated siRNA or CRISPRi/a Pool | For functional perturbation of the TF to establish causal links between binding and expression changes. |
| MACS2 & HOMER Software | Industry-standard, reliable tools for ChIP-seq peak calling and motif discovery, ensuring reproducible analysis. |
| Integrative Genomics Viewer (IGV) | Enables simultaneous visual inspection of aligned reads from multiple assays at specific genomic loci. |
Within the broader thesis on ChIP-seq as a cornerstone technology for elucidating transcription factor (TF) binding mechanisms, this document transitions from fundamental discovery to translational application. Chromatin Immunoprecipitation followed by sequencing (ChIP-seq) has evolved from a mapping tool to a critical engine for defining pathogenic gene regulatory networks in complex diseases. By providing genome-wide, high-resolution maps of TF binding events, ChIP-seq enables the systematic deconstruction of dysregulated transcriptional circuitry in oncology and immunology, directly informing biomarker discovery and therapeutic development.
Core Principles of Translational ChIP-seq Analysis
Translational ChIP-seq extends beyond peak calling to integrated network analysis. Key steps include:
- Comparative Peak Calling: Identifying differential TF binding events between disease (e.g., tumor, inflamed tissue) and control samples.
- Integrative Genomics: Correlating binding events with transcriptomic (RNA-seq) and epigenomic (ATAC-seq) data to establish functional regulatory nodes.
- Motif and Cistrome Analysis: Discovering over-represented DNA binding motifs within differential peaks to infer cooperative TFs and pioneer factors.
- Pathway Enrichment: Linking target genes of dysregulated TFs to oncogenic or immunomodulatory signaling pathways (e.g., MAPK, JAK-STAT, NF-κB).
Quantitative Data on Dysregulated TF Networks in Disease
The following tables summarize key quantitative findings from recent translational ChIP-seq studies.
Table 1: Dysregulated TFs in Selected Cancers (ChIP-seq Findings)
| Cancer Type | Dysregulated Transcription Factor | Change in Binding Events (vs. Normal) | Key Direct Target Genes | Associated Pathway |
|---|---|---|---|---|
| Prostate Cancer | AR (Androgen Receptor) | ~15,000 novel binding sites in CRPC* | UBE2C, FOXM1 | Androgen Signaling |
| Triple-Negative Breast Cancer | STAT3 | >8,000 gained binding sites | MYC, CCND1, BIRC5 | JAK-STAT3 |
| Diffuse Large B-Cell Lymphoma | BCL6 | Oncogenic "super-enhancer" binding | MIR17HG, BCL2 | B-cell Differentiation |
| Acute Myeloid Leukemia | PU.1 | Binding loss at ~60% of normal loci | SPIB, FLT3 | Hematopoiesis |
*CRPC: Castration-Resistant Prostate Cancer.
Table 2: Immunological TFs Mapped by ChIP-seq in Disease Contexts
| Disease/Context | Transcription Factor | Cell Type | Binding Sites Identified | Functional Outcome |
|---|---|---|---|---|
| Rheumatoid Arthritis | NF-κB (p65) | Synovial Fibroblasts | ~12,000 inflammatory-induced sites | Upregulation of IL6, CXCL8 |
| T-cell Exhaustion | TOX | PD-1+ CD8+ T-cells | Pioneers ~9,000 de novo sites | Sustains exhausted phenotype |
| Regulatory T-cells | FOXP3 | Human Tregs | >10,000 stable binding sites | Repression of IL2, activation of CTLA4 |
| Macrophage Polarization | IRF4 | M2 Macrophages | ~7,000 binding sites | Promotes tissue repair genes |
Detailed Experimental Protocols
Protocol 1: Comparative ChIP-seq for Patient-Derived Xenograft (PDX) Tumors
Objective: To map differential oncogenic TF binding between malignant and matched normal tissue.
- Sample Preparation: Snap-freeze PDX tumor and normal tissue. Crosslink with 1% formaldehyde for 10 min. Homogenize and isolate nuclei.
- Chromatin Shearing: Using a focused ultrasonicator, shear crosslinked chromatin to 200-500 bp fragments. Confirm size via agarose gel electrophoresis.
- Immunoprecipitation: Incubate chromatin (50 µg) with 5 µg of validated, target-specific TF antibody (e.g., anti-STAT3) or IgG control overnight at 4°C. Capture with protein A/G magnetic beads.
- Library Preparation & Sequencing: Reverse crosslinks, purify DNA. Prepare sequencing libraries using a ThruPLEX DNA-seq kit. Sequence on an Illumina NovaSeq platform to a depth of 20-40 million non-duplicate reads per sample.
- Bioinformatics Analysis: Align reads to reference genome (hg38) using BWA. Call peaks with MACS2. Perform differential binding analysis with DiffBind. Integrate with paired RNA-seq data using R/Bioconductor packages.
Protocol 2: ChIP-seq for Low-Cell-Number Primary Immune Cells
Objective: To profile TF binding in rare populations (e.g., tumor-infiltrating T-cells).
- Cell Sorting & Micro-Volume ChIP: FACS-sort 50,000 – 100,000 target cells. Perform crosslinking and lysis in a minimal volume (100 µL). Use a micrococcal nuclease (MNase)-based digestion for precise chromatin fragmentation.
- Carrier-Assisted Immunoprecipitation: Add 100 ng of Drosophila S2 cell chromatin as a carrier. Proceed with IP using a high-affinity nanobody-conjugated bead system to improve yield.
- Library Amplification: Post-IP DNA cleanup, use a low-input library prep kit (e.g., Takara SMARTer ThruPLEX). Incorporate unique molecular identifiers (UMIs) to mitigate PCR bias.
- Sequencing & Analysis: Sequence deeply (30-50 million reads). Process data with a pipeline optimized for low-input samples (e.g., SEACR for peak calling, accounting for carrier genome alignment).
Visualizations of Key Concepts and Workflows
Title: Translational ChIP-seq Data Analysis Pipeline
Title: TF Targeting in Oncogenic Signaling Pathways
The Scientist's Toolkit: Research Reagent Solutions
| Item | Function in Translational ChIP-seq | Example/Note |
|---|---|---|
| Validated ChIP-seq Grade Antibodies | High specificity for target TF is critical for reliable data. | CST #12640 (STAT3), Abcam ab4729 (AR). Validate with knockout cell controls. |
| Low-Input/Carrier ChIP Kits | Enable profiling of rare clinical samples (biopsies, sorted cells). | Diagenode MicroChIP kit, Cell Signaling Technology ChIP-IT High Sensitivity. |
| Magnetic Beads (Protein A/G) | Efficient capture of antibody-chromatin complexes. | Dynabeads for consistent, low-background recovery. |
| ThruPLEX DNA-seq Kit | Robust library preparation from picogram ChIP DNA inputs. | Incorporates UMIs, minimizes bias for complex sample analysis. |
| Crosslinking Reagents | Preserve transient TF-DNA interactions. | Formaldehyde (standard); DSG for stabilizing weaker complexes. |
| MNase (Micrococcal Nuclease) | For precise nucleosomal positioning assays or low-cell-number protocols. | Yields mononucleosomal DNA fragments. |
| Spike-in Chromatin (e.g., S. pombe, Drosophila) | Normalizes for technical variation (IP efficiency, sample prep) in comparative studies. | Essential for quantitative differential binding analysis. |
| UMI Adapters | Unique Molecular Identifiers to de-duplicate reads and reduce PCR amplification bias. | Critical for accurate quantitation in low-input experiments. |
Applications in Drug Development
- Target Identification: ChIP-seq identifies direct TF targets driving disease, validating TFs or their cofactors as drug targets (e.g., targeting BCL6 corepressors in lymphoma).
- Biomarker Discovery: Differential TF binding signatures can stratify patients and predict therapeutic response (e.g., AR cistrome changes predicting resistance to anti-androgens).
- Mechanism of Action Studies: Pharmacodynamic ChIP-seq assays confirm on-target engagement of novel therapeutics (e.g., loss of oncogenic TF binding post-treatment).
- Combination Therapy Rationale: Mapping cooperative TF networks reveals vulnerabilities and synergistic targets (e.g., concurrent inhibition of AP-1 and NF-κB pathways).
The translational application of ChIP-seq represents a paradigm shift, moving from descriptive maps of binding sites to functional, disease-relevant network models. By integrating robust experimental protocols with advanced bioinformatics, researchers can precisely define the dysregulated TF circuitry in cancer and immunology. This mechanistic insight is indispensable for the rational development of targeted therapies and companion diagnostics, cementing ChIP-seq's role as an essential technology in modern translational medicine and drug discovery.
Solving the Puzzle: Expert Troubleshooting and Optimization Strategies for Reliable ChIP-seq Data
Chromatin Immunoprecipitation followed by sequencing (ChIP-seq) remains the cornerstone experimental technique for mapping in vivo transcription factor (TF) binding sites and epigenetic modifications. Within the broader thesis of deciphering transcriptional regulatory networks, the integrity of ChIP-seq data is paramount. Three interrelated technical pitfalls—Low Signal, High Background, and Unreliable Peak Calls—routinely compromise data interpretation, leading to false mechanistic inferences about TF binding dynamics, cooperativity, and gene regulation. This technical guide provides a diagnostic framework and actionable protocols to identify, troubleshoot, and resolve these issues, ensuring robust discovery in TF binding research.
Quantitative Metrics for Diagnosing Pitfalls
A systematic assessment begins with the quantitative evaluation of key sequencing metrics. The following table summarizes ideal targets and indicators of common problems.
Table 1: Key ChIP-seq QC Metrics and Diagnostic Indicators
| Metric | Ideal Target / Profile | Indicator of Low Signal | Indicator of High Background | Tool for Calculation |
|---|---|---|---|---|
| Fraction of Reads in Peaks (FRiP) | >1% for TFs; >5-30% for histones | FRiP < 0.5% | FRiP may be artificially high due to broad, diffuse peaks | plotFingerprint (DeepTools) |
| Cross-Correlation (NSC/ RSC) | NSC ≥ 1.05, RSC ≥ 1 (≥0.8 acceptable) | NSC < 1.05 | RSC < 0.8 | phantompeakqualtools |
| Peak Number | Experiment/antibody dependent; consistent across replicates | Drastically lower than expected | Excessively high, many low-confidence calls | MACS2, SEACR |
| Reads in Blacklisted Regions | <1% of mapped reads | N/A | >5% of mapped reads | blacklist assessment (ENCODE) |
| Library Complexity (NRF/PBC1) | NRF > 0.9; PBC1 > 0.9 | PBC1 < 0.5 | PBC1 may be low due to amplification artifacts | preseq |
| Strand Cross-Correlation Profile | Sharp phantom peak at fragment length | Broad or absent phantom peak | Strong shift to read length (0-50 bp) | plotFingerprint |
Experimental Protocols for Troubleshooting and Validation
Protocol: Titration-Based Antibody Validation for Low Signal
Objective: Determine the optimal antibody:chromatin ratio to maximize immunoprecipitation efficiency while minimizing background. Materials: Sheared chromatin (1-2 µg), ChIP-validated antibody, Protein A/G beads, qPCR reagents for positive/negative control genomic loci. Procedure:
- Prepare four identical chromatin aliquots.
- Add antibody at four different concentrations (e.g., 0.5 µg, 1 µg, 2 µg, 5 µg). Include a no-antibody control.
- Perform standard ChIP protocol (crosslinking reversal, DNA purification).
- Quantify DNA yield via qPCR at known binding sites (positive control) and non-bound regions (negative control).
- Calculate Signal-to-Noise Ratio (SNR):
(%IP at positive locus) / (%IP at negative locus). - Select the antibody concentration yielding the highest SNR before saturation. Proceed to library prep with this condition.
Protocol: Sequential Wash for High Background Reduction
Objective: Remove non-specifically bound chromatin through stringent, sequential washing. Materials: ChIP samples post-IP on beads, wash buffers. Procedure: After standard low-salt wash, perform the following sequential washes on a rotating wheel at 4°C for 5 minutes each:
- High-Salt Wash: 1x with 500 µL of Wash Buffer (50 mM HEPES pH 7.5, 500 mM NaCl, 1 mM EDTA, 1% Triton X-100, 0.1% Na-Deoxycholate).
- LiCl Wash: 1x with 500 µL of LiCl Wash Buffer (250 mM LiCl, 10 mM Tris pH 8.0, 1 mM EDTA, 0.5% NP-40, 0.5% Na-Deoxycholate).
- TE Wash: 2x with 500 µL of TE buffer (10 mM Tris pH 8.0, 1 mM EDTA).
- Proceed with elution and DNA purification. Monitor background via qPCR at negative control loci.
Visualizing Workflows and Relationships
Title: Diagnostic and Solution Workflow for ChIP-seq Pitfalls
Title: ChIP-seq Workflow with Critical Quality Control Points
The Scientist's Toolkit: Research Reagent Solutions
Table 2: Essential Reagents and Materials for Robust ChIP-seq
| Item | Function & Rationale | Example/Consideration |
|---|---|---|
| ChIP-Validated Antibody | Specificity is the single most critical factor. Binds target epitope in crosslinked chromatin context. | Use antibodies with published ChIP-seq data (e.g., ENCODE validation). Avoid polyclonals with high background. |
| Protein A/G Magnetic Beads | Efficient capture of antibody-antigen complexes, enabling stringent washing. | Magnetic beads simplify wash steps and reduce background vs. agarose beads. |
| UltraPure SDS/LiCl Solutions | Components of stringent wash buffers to remove non-specific DNA-protein interactions. | Prepare fresh from high-purity stocks to prevent RNase/DNase contamination. |
| Glycogen or Carrier RNA | Co-precipitant to visualize and recover picogram amounts of ChIP DNA during ethanol precipitation. | Essential for low-signal TF ChIP. Use nuclease-free glycogen. |
| High-Fidelity Library Prep Kit | Amplifies limited ChIP DNA for sequencing while maintaining complexity and minimizing duplicates. | Kits optimized for low-input DNA (e.g., ThruPLEX) are recommended. |
| SPRI Beads (Ampure XP) | Size selection and cleanup of libraries; removes primer dimers and large contaminants. | Critical for obtaining a tight library size distribution, improving cluster generation. |
| Validated Positive Control Primers | qPCR primers for known binding sites for the target TF. | Essential for in-process validation of ChIP efficiency before sequencing. |
| Negative Control Genomic DNA | DNA from a non-target region or an isotype control IP sample. | Provides baseline for signal-to-noise calculation and peak calling threshold. |
| ENCODE Blacklist Regions | A curated set of genomic regions with anomalous, unstructured signals. | Filtering peaks in blacklisted regions reduces false positive calls. |
Within the broader thesis investigating transcription factor (TF) binding mechanisms via ChIP-seq, experimental optimization is paramount. Three critical levers—antibody titration, sonication, and PCR amplification—directly influence signal-to-noise ratios, resolution, and the quantitative accuracy of binding profiles. This guide provides a technical framework for systematically optimizing these parameters to produce high-quality, reproducible data for downstream mechanistic analysis.
Titrating Antibody Amounts
The specificity and efficiency of immunoprecipitation (IP) hinge on antibody quantity. Insufficient antibody leads to low yield; excess increases non-specific background.
Experimental Protocol: Antibody Titration
- Chromatin Preparation: Fix cells (e.g., 1x10⁷ per condition) with 1% formaldehyde for 10 min. Quench with 125 mM glycine. Lyse cells and pellet nuclei.
- Chromatin Shearing: Sonicate to achieve ~200-500 bp fragments (see Section 3). Centrifuge to clear debris. Aliquot chromatin equally.
- IP Setup: Set up identical IP reactions with a dilution series of the target TF antibody (e.g., 0.5 µg, 1 µg, 2 µg, 5 µg). Include a constant amount of IgG as a negative control.
- Incubation: Incubate antibody with chromatin overnight at 4°C with rotation.
- Recovery: Add protein A/G beads, incubate, wash extensively.
- Elution & Reverse Crosslinking: Elute complexes, reverse crosslinks at 65°C overnight.
- DNA Purification: Treat with RNase A and Proteinase K, purify DNA using silica columns.
- Quantification: Quantify DNA by qPCR at known positive and negative genomic control regions.
Key Data & Optimization Table
Table 1: Example Data from Anti-ERα Antibody Titration (MCF-7 Cells)
| Antibody Amount (µg) | DNA Yield (ng) | % Input (Positive Locus) | Signal/Noise (Pos/Neg Locus) | Recommended |
|---|---|---|---|---|
| 0.5 | 2.1 | 0.8% | 5.2 | Sub-optimal |
| 1.0 | 4.5 | 1.9% | 12.7 | Optimal |
| 2.0 | 5.1 | 2.1% | 11.3 | Saturation |
| 5.0 | 5.8 | 2.2% | 8.1 | High Background |
| IgG (2 µg) | 0.9 | 0.1% | 1.0 | Control |
Optimization Goal: Select the lowest antibody amount yielding maximal signal-to-noise. Saturation often increases non-specific binding.
Optimizing Sonication Conditions
Sonication dictates chromatin fragment size, affecting resolution and IP efficiency. Both under- and over-sonication are detrimental.
Experimental Protocol: Sonication Optimization
- Nuclei Preparation: Prepare fixed nuclei from ~5x10⁶ cells per condition.
- Sonication Setup: Aliquot nuclei suspension. Using a focused ultrasonicator (e.g., Covaris), vary:
- Duration (e.g., 2, 4, 8, 12 min)
- Peak Incident Power (e.g., 75W, 105W, 135W)
- Duty Factor (e.g., 10%, 20%)
- Keep cycles/burst constant.
- Debris Removal: Centrifuge sonicated samples. Collect supernatant.
- Fragment Analysis: Reverse crosslink an aliquot (65°C, 2h). Purify DNA. Analyze fragment size distribution using a Bioanalyzer or Tapestation.
- IP Validation: Perform IP with a standardized antibody on samples from each condition. Assess yield and resolution by qPCR.
Key Data & Optimization Table
Table 2: Sonication Optimization for TF ChIP-seq (Covaris S220)
| Condition | Time (min) | Peak Power (W) | Duty Factor | Mean Fragment (bp) | % Fragments 200-600 bp | IP Yield (ng) |
|---|---|---|---|---|---|---|
| A | 2 | 105 | 10% | 680 | 45% | 3.2 |
| B | 4 | 105 | 10% | 420 | 78% | 6.5 |
| C | 8 | 105 | 10% | 190 | 65%* | 5.1 |
| D | 4 | 135 | 20% | 150 | 40%* | 3.8 |
*Excess short fragments reduce IP efficiency. Optimal: Condition B balances ideal size range and high yield.
PCR Amplification of Libraries
Post-IP DNA is scant, requiring PCR amplification for sequencing. Cycle number must be minimized to avoid skewing representation and creating duplicates.
Experimental Protocol: PCR Cycle Determination
- Library Preparation: Use standardized, adapter-ligated DNA from an optimized ChIP.
- Aliquoting: Split library into multiple equal aliquots.
- Gradient PCR: Amplify aliquots with a high-fidelity polymerase for different cycle numbers (e.g., 8, 10, 12, 14, 16).
- Clean-up: Purify PCR products.
- Quantification & Analysis: Quantify by Qubit. Analyze fragment profiles. Assess complexity by qPCR-based quantification or by running pilot sequencing to measure duplicate read rates.
Key Data & Optimization Table
Table 3: Impact of PCR Cycle Number on Library Quality
| PCR Cycles | Library Yield (nM) | % Duplicate Reads* | Complexity Estimate (Molecules) | Recommended Cycles |
|---|---|---|---|---|
| 8 | 2.1 | 8% | High | Possibly sub-optimal yield |
| 10 | 5.8 | 12% | High | Optimal |
| 12 | 15.2 | 25% | Medium | Acceptable |
| 14 | 32.5 | 48% | Low | Avoid |
| 16 | 65.0 | 72% | Very Low | Avoid |
*Projected from pilot data. Actual rates depend on initial material.
Optimization Goal: Use the minimum cycles yielding sufficient library for sequencing (typically 5-10 nM) while keeping duplicates <20%.
The Scientist's Toolkit: Research Reagent Solutions
Table 4: Essential Materials for ChIP-seq Optimization
| Item | Function & Rationale |
|---|---|
| High-Specificity Antibody | Validated for ChIP; essential for target enrichment with minimal cross-reactivity. |
| Magnetic Protein A/G Beads | Efficient capture of antibody-chromatin complexes; low non-specific binding. |
| Focused Ultrasonicator (e.g., Covaris) | Provides reproducible, tunable shearing with consistent fragment size distribution. |
| High-Fidelity PCR Master Mix | Amplifies library DNA with minimal bias and error introduction. |
| Dual-Indexed Adapter Kit | Enables multiplexing; reduces index hopping artifacts. |
| DNA High-Sensitivity Assay (Bioanalyzer/TapeStation) | Accurately quantifies low-abundance DNA and assesses fragment size. |
| qPCR Reagents for SYBR Green Assays | Quantifies IP efficiency at control loci during optimization phases. |
| SPRI Beads (e.g., AMPure XP) | For size selection and clean-up of DNA fragments after sonication and library prep. |
Visualizing Workflows and Relationships
Diagram 1: Core ChIP-seq Protocol with Key Optimization Levers
Diagram 2: Antibody Titration Logic & Outcomes
Diagram 3: Sonication Parameters Control Fragment Size
In the investigation of transcription factor (TF) binding mechanisms via ChIP-seq, distinguishing biological signal from technical artifact is paramount. Artifacts arising from GC bias, low mapability, and alignment to blacklisted genomic regions can confound peak calling, leading to false positives and obscuring true regulatory elements. This guide provides a technical framework for identifying and mitigating these pervasive issues, ensuring robust and interpretable results in TF discovery research.
Understanding and Quantifying the Artifacts
GC Bias
GC bias refers to the non-uniform sequencing coverage dependent on the local guanine-cytosine (GC) content of DNA fragments. It originates from PCR amplification steps during library preparation and can drastically skew apparent enrichment.
Quantitative Impact:
- Coverage can drop by up to 50% in regions of extremely high or low GC content compared to regions with ~50% GC.
- Bias is most pronounced with low-input protocols (<10 ng DNA).
Table 1: Common GC Bias Metrics and Thresholds
| Metric | Description | Typical Threshold for Concern | Tool for Assessment |
|---|---|---|---|
| Coverage vs. GC Correlation | Pearson correlation between coverage and GC fraction. | |r| > 0.2 | deepTools plotCorrelation, Qualimap |
| Normalized Coverage Deviation | Max fold-change in normalized coverage across GC bins. | > 2-fold | Preseq gc_extrap, in-house scripts |
Mapability (Mappability)
Mapability defines the uniqueness of a genomic sequence, i.e., the probability a short read originating from that region can be uniquely aligned. Low-mapability regions (e.g., repeat elements, pseudogenes) cause ambiguous alignments, artificially inflating or deflating coverage.
Quantitative Impact:
- Up to 30% of reads from a standard mammalian ChIP-seq may align non-uniquely.
- ~2-5% of called peaks may fall entirely within low-mapability zones.
Blacklisted Genomic Regions
These are regions with consistently high, unstructured signal across experiments and technologies, caused by anomalous properties like uncollapsed repeats, telomeres, centromeres, and ultra-high signal from open chromatin in control inputs. Peaks in these regions are nearly always artifactual.
Standard Resources:
- ENCFF356LFX (Human, GRCh38) and ENCFF547MET (Mouse, mm10) from the ENCODE consortium.
- Contains thousands of regions, covering ~1% of the mouse genome and ~0.5% of the human genome.
Experimental Protocols for Mitigation
Protocol 2.1: Pre-Sequencing Mitigation of GC Bias
Title: Optimized Library Preparation for GC-Neutral Amplification Principle: Use polymerases and PCR kits designed for balanced amplification.
- Input Quantification: Use fluorometric methods (e.g., Qubit) for accurate DNA measurement.
- PCR Enzyme Selection: Employ high-fidelity polymerases with GC buffers (e.g., KAPA HiFi HotStart, Q5 High-Fidelity).
- Cycle Minimization: Determine the minimum number of PCR cycles required via qPCR library quantification; aim for ≤12 cycles.
- Size Selection: Use double-sided bead-based selection to narrow fragment distribution, reducing complexity.
Protocol 2.2: Post-Sequencing Computational Correction
Title: Bioinformatic Pipeline for Artifact Mitigation Principle: Apply sequential normalization and filtering.
- Alignment with Mapability Awareness:
- Use aligners (e.g.,
BWA mem,Bowtie2) with the-kflag to report multiple alignments. - Process alignments with tools like
Picard MarkDuplicatesto handle PCR duplicates.
- Use aligners (e.g.,
- GC Bias Correction:
- Generate a GC-content profile for the genome using
computeGCBias(deepTools). - Correct raw coverage using
correctGCBias(deepTools) which adjusts based on the observed vs. expected read count per GC bin.
- Generate a GC-content profile for the genome using
- Blacklist Filtering:
- Align reads to the reference genome.
- Before peak calling, use
bedtools intersect -vto remove reads falling within the species-appropriate ENCODE blacklist.
- Mapability-Aware Peak Calling:
- Provide a mapability track (e.g., a bigWig file of unique mappability scores) to peak callers like
MACS2(using--broadanalysis can be more lenient) or useSICER2which explicitly models spatial distributions to better handle diffuse signal in repetitive regions.
- Provide a mapability track (e.g., a bigWig file of unique mappability scores) to peak callers like
Visualization of Workflows and Relationships
Diagram Title: ChIP-seq Analysis Pipeline with Artifact Mitigation
The Scientist's Toolkit: Research Reagent Solutions
Table 2: Essential Reagents and Tools for Artifact-Reduced ChIP-seq
| Item | Function & Rationale | Example Product/Catalog |
|---|---|---|
| GC-Neutral PCR Master Mix | Polymerase/buffer system for uniform amplification across GC content, reducing pre-alignment bias. | KAPA HiFi HotStart ReadyMix (Roche), NEBNext Ultra II Q5 Master Mix (NEB) |
| High-Sensitivity DNA Assay | Accurate quantification of low-input and post-shearing DNA for optimal library construction. | Qubit dsDNA HS Assay Kit (Thermo Fisher) |
| Dual-Size Selection Beads | Precise isolation of target fragment size range, reducing library complexity and bias. | SPRIselect Beads (Beckman Coulter) |
| Species-Specific Blacklist BED File | Definitive set of genomic coordinates to filter post-alignment. | ENCODE Blacklist (e.g., ENCFF356LFX for hg38) |
| Mappability Track | Pre-computed genome file scoring uniqueness of k-mers for filtering/weighting. | UCSC Genome Browser 24-mer or 36-mer mapability bigWig |
| GC Correction Tool | Software package implementing algorithms for normalizing coverage by GC content. | deepTools correctGCBias |
| Artifact-Aware Peak Caller | Peak calling software that incorporates input controls and can handle diffuse signal. | MACS2, SICER2 |
Validation and Quality Control
Post-mitigation, validate data quality:
- Cross-Correlation: Ensure normalized strand coefficient (NSC) > 1.05 and relative strand correlation (RSC) > 0.8.
- FRiP Score: Fraction of Reads in Peaks should be consistent with expectations for the TF (e.g., >1% for broad marks, >5% for punctate TFs).
- Irreproducible Discovery Rate (IDR): Assess reproducibility between replicates; peaks passing IDR threshold (e.g., 0.05) are high-confidence.
- Visual Inspection: Use genome browsers (e.g., IGV) to inspect top-called peaks for clean, localized signal absent from blacklisted regions.
Systematic addressing of GC bias, mapability, and blacklisted regions is not merely a quality control step but a foundational component of rigorous ChIP-seq analysis for TF binding discovery. The protocols and toolkit outlined herein enable researchers to distill genuine regulatory biology from technical noise, yielding discoveries that reliably inform downstream mechanistic studies and therapeutic target identification.
Within the broader thesis on ChIP-seq's role in elucidating transcription factor (TF) binding mechanisms, significant challenges arise when investigating low-abundance TFs, specific histone modifications, or rare cell populations. These difficult targets are critical for understanding gene regulatory networks in development, disease, and drug response. This technical guide outlines current, validated strategies to overcome signal-to-noise limitations, material scarcity, and technical artifacts.
Low-Abundance Transcription Factors
Targeting TFs with low cellular copy numbers or transient binding requires optimization at every step.
Key Strategies:
- Crosslinking & Shearing: Use double crosslinking (e.g., DSG followed by formaldehyde) to capture transient interactions. Optimize sonication to achieve 100-300 bp fragments without damaging epitopes.
- Signal Amplification: Employ methods like CUT&RUN or CUT&Tag, which use protein A-Tn5 fusion proteins to perform tagmentation in situ, drastically reducing background compared to traditional ChIP.
- High-Affinity Reagents: Utilize validated monoclonal antibodies or recombinant binders (e.g., Nanobodies, dCas9 fusions) with high specificity and low non-specific binding.
Table 1: Comparison of Methods for Low-Abundance TF Mapping
| Method | Typical Cell Input | Signal-to-Noise Ratio | Key Advantage | Major Limitation |
|---|---|---|---|---|
| Standard ChIP-seq | 0.5-10 million | Low-High | Well-established protocol | High background, large input |
| CUT&RUN | 10,000 - 500,000 | Very High | Low background, small input | Requires permeabilization |
| CUT&Tag | 100 - 100,000 | Very High | Simple protocol, lowest input | Tagmentation bias |
| DamID | >10,000 | High | No antibody needed | Genomic methylation background |
Detailed CUT&Tag Protocol for Low-Abundance TFs:
- Cell Preparation: Harvest and wash 100,000 cells. Permeabilize with Digitonin buffer (0.01% in wash buffer).
- Antibody Binding: Incubate with primary antibody against target TF (1:50-1:100 dilution) overnight at 4°C in Antibody Buffer.
- Secondary Antibody Binding: Incubate with a concatemer-based secondary antibody (e.g., pA-Tn5) for 1 hour at room temperature.
- Tagmentation: Activate pA-Tn5 in Tagmentation Buffer (10mM Mg2+) for 1 hour at 37°C.
- DNA Extraction: Halt reaction with EDTA, extract DNA with Phenol-Chloroform, and purify.
- Library Prep & Sequencing: Amplify extracted DNA via PCR for 12-14 cycles and sequence on a high-output platform (≥ 5 million reads).
Histone Modifications with Overlapping Functions
Certain modifications (e.g., H3K4me1 vs. H3K4me3) require extreme specificity to delineate their distinct roles.
Key Strategies:
- Antibody Validation: Use orthogonal validation (e.g., peptide arrays, KO cell lines) to confirm antibody specificity. Refer to repositories like the Histone Antibody Specificity Database.
- Multiplexing: Employ sequential ChIP (ChIP-reChIP) or newer single-pot methods to map co-occurring modifications on the same chromatin fiber.
- Chemical Derivatization: Utilize methods like Diagenode's iChmo-seq, which chemically converts specific modifications to enhance antibody recognition.
Table 2: Recommended Antibodies for Challenging Histone Modifications
| Target | Recommended Clone/Supplier | Validation Method | Recommended Application |
|---|---|---|---|
| H3K4me1 | CMA303 (Millipore) | Peptide array, KO validation | Enhancer mapping (CUT&Tag) |
| H3K27ac | D5E4 (CST) | KO validation, WB/IF | Active enhancer marking |
| H3K9me3 | 6F12-H4 (Active Motif) | Peptide competition, IF | Heterochromatin mapping |
Detailed Sequential ChIP (Re-ChIP) Protocol:
- First ChIP: Perform standard ChIP for the first histone mark (e.g., H3K4me1). Elute the immune complexes not with SDS buffer, but with 10mM DTT at 37°C for 30 minutes.
- Complex Recapture: Dilute the eluate 1:50 with dilution buffer and subject it to a second round of immunoprecipitation with the antibody for the second mark (e.g., H3K27ac).
- Final Elution & Processing: Elute the final complexes with standard SDS elution buffer. Reverse crosslinks, purify DNA, and proceed to library construction.
Challenging Cell Types
Rare primary cells, neurons, adipocytes, and circulating tumor cells present material and accessibility hurdles.
Key Strategies:
- Input Minimization: Adopt ultra-low input protocols (CUT&Tag, UL1-ChIP). Use carrier materials like yeast chromatin or recombinant nucleosomes sparsely.
- Chromatin Accessibility: Optimize permeabilization conditions for each cell type (e.g., higher digitonin for neurons, NP-40 for immune cells).
- Cell Fixation: For tissues, consider rapid crosslinking in situ or nuclei extraction from flash-frozen samples to preserve native states.
Table 3: Solutions for Common Challenging Cell Types
| Cell Type | Primary Challenge | Suggested Method | Critical Modification |
|---|---|---|---|
| Primary Neurons | Fragility, low yield | CUT&Tag on nuclei | Gentle nuclei isolation, 0.025% Digitonin |
| Adipocytes | High lipid content | ChIP on isolated nuclei | Sucrose gradient purification of nuclei |
| Rare Populations (FACS-sorted) | Very low cell count (<10,000) | scChIP-seq / CoBATCH | Barcoding before pooling, whole-genome amplification |
| Formalin-Fixed Paraffin-Embedded (FFPE) | Crosslink damage | FFPE-ChIP | Extensive chromatin repair (enzyme mix) prior to IP |
The Scientist's Toolkit: Research Reagent Solutions
Table 4: Essential Reagents for Difficult ChIP Targets
| Item | Function | Example Product/Supplier |
|---|---|---|
| Concanavalin A Beads | For CUT&RUN/Tag; binds cell membranes to immobilize nuclei. | Polysciences, Inc. |
| Recombinant pA-Tn5 | Fusion protein for in situ tagmentation; critical for CUT&Tag. | Epicypher |
| High-Specificity Monoclonal Antibody | Reduces background for low-abundance targets. | Cell Signaling Technology, Active Motif |
| Digitonin | Gentle permeabilizing agent for intact nuclei work. | MilliporeSigma |
| Duplex-Specific Nuclease (DSN) | Normalizes libraries from limited input, reduces duplicate reads. | Evrogen |
| Spike-in Chromatin | Exogenous chromatin (e.g., D. melanogaster) for normalization. | Active Motif, Diagenode |
| Nuclei Extraction Buffer | Optimized for tough tissues/cells (e.g., NE1 from CUT&RUN kit). | EpiCypher |
| Multiplexing Oligos & Enzymes | For single-cell or low-input barcoded library prep. | Illumina, Takara Bio |
Visualizations
Within the framework of ChIP-seq research aimed at elucidating transcription factor (TF) binding mechanisms, stringent quality control (QC) is paramount for generating biologically interpretable data. This technical guide details the essential QC checkpoints, from initial chromatin fixation through to final sequencing library assessment, providing researchers and drug development professionals with protocols and benchmarks to ensure robust discovery.
The validity of conclusions drawn from ChIP-seq experiments hinges on the quality of each preparative step. Inefficient cross-linking, poor antibody specificity, or low-complexity libraries can introduce artifacts, obscuring true TF binding events. This guide frames QC within the discovery pipeline, where each checkpoint safeguards the mechanistic insights into gene regulation.
Checkpoint 1: Assessment of Cross-linking Efficiency
Cross-linking stabilizes protein-DNA interactions. Under- or over-cross-linking can reduce yield or mask epitopes.
Experimental Protocol: Reverse Cross-linking & Gel Electrophoresis
- Sample: Take a 10% aliquot of sonicated chromatin before immunoprecipitation.
- Reverse Cross-link: Add NaCl to 200 mM and incubate at 65°C for 4-6 hours (or overnight).
- DNA Purification: Treat with Proteinase K, then purify DNA via phenol-chloroform extraction or spin columns.
- Analysis: Run purified DNA on a 1.5% agarose gel. Efficient sonication should yield a smear primarily between 100-500 bp. A shift towards larger fragments (>1000 bp) suggests insufficient cross-linking reversal or inefficient sonication.
Quantitative Benchmark:
Diagram 1: Cross-linking efficiency QC workflow.
Checkpoint 2: Antibody Specificity & IP Efficiency
The specificity of the anti-TF antibody is the single greatest determinant of ChIP-seq success.
Experimental Protocol: Positive Control qPCR
- Design: Design TaqMan or SYBR Green primers for 3-5 known, high-confidence binding sites for the TF and 3 negative control genomic regions.
- qPCR: Perform qPCR on the immunoprecipitated (IP) DNA, input DNA (reference), and a mock IP (no antibody/IgG control) sample.
- Calculation: Calculate % Input for each region:
% Input = 2^(Ct_input - Ct_IP) * Dilution Factor * 100. - Analysis: Specific enrichment is confirmed by high % Input at positive sites and background-level signal at negative sites and in mock IP.
Table 1: Example qPCR QC Data for a Hypothetical TF
| Genomic Region | IP (% Input) | Mock IP (% Input) | Fold-Enrichment (IP/Mock) | Interpretation |
|---|---|---|---|---|
| Positive Site 1 | 5.2% | 0.08% | 65 | Strong Pass |
| Positive Site 2 | 3.8% | 0.06% | 63 | Strong Pass |
| Negative Region 1 | 0.09% | 0.07% | 1.3 | Pass |
| Negative Region 2 | 0.11% | 0.10% | 1.1 | Pass |
Table 2: Key Research Reagent Solutions
| Reagent/Category | Example Product/Type | Function in QC |
|---|---|---|
| Primary Antibody | Validated ChIP-grade antibody (e.g., Cell Signaling Tech., Abcam, Diagenode) | Specifically immunoprecipitates the target TF; key to assay specificity. |
| qPCR Assay | Validated primer-probe sets (e.g., Thermo Fisher TaqMan Assays) or designed primers | Quantitatively measures enrichment at control loci for IP efficiency. |
| Magnetic Beads | Protein A/G beads (e.g., Dynabeads) | Efficient capture of antibody-bound complexes; low non-specific DNA binding. |
| Library Prep Kit | High-complexity, low-input kits (e.g., NEB Next, Illumina DNA Prep) | Generates sequencing libraries with minimal bias from low-mass IP samples. |
| DNA High-Sensitivity Assay | Agilent Bioanalyzer HS DNA chip / Thermo Fisher Qubit dsDNA HS Assay | Accurately quantifies and assesses size distribution of fragile ChIP DNA. |
Checkpoint 3: Sequencing Library Complexity Assessment
Library complexity refers to the number of unique DNA fragments sequenced. Low complexity leads to redundant, non-informative reads.
Primary Metric: Non-Redundant Fraction (NRF) & PCR Bottlenecking Coefficient (PBC)
- Data Source: Aligned, duplicate-marked BAM files.
- Calculation:
NRF = (Number of distinct unique positions) / (Total read pairs). A high NRF (>0.8) is desirable.PBC = (Number of genomic locations with exactly 1 read) / (Number of genomic locations with at least 1 read).
- Benchmark: ENCODE guidelines classify libraries as:
- PBC1 > 0.9: High complexity, minimal bottlenecking.
- 0.8 < PBC1 < 0.9: Moderate complexity.
- PBC1 < 0.8: Low complexity; severe bottlenecking; consider re-doing experiment.
Table 3: Library Complexity Metrics from ENCODE Standards
| QC Metric | Optimal (Gold) | Acceptable (Silver) | Unacceptable |
|---|---|---|---|
| PCR Bottlenecking (PBC1) | > 0.9 | 0.8 - 0.9 | < 0.8 |
| Non-Redundant Fraction (NRF) | > 0.9 | 0.8 - 0.9 | < 0.8 |
| Estimated Library Complexity (M unique) | > 10M | 5M - 10M | < 5M |
Diagram 2: Library complexity assessment logic.
Integrated QC Workflow
A successful ChIP-seq experiment requires passing all sequential checkpoints.
Diagram 3: Sequential ChIP-seq QC decision pathway.
Rigorous adherence to these QC checkpoints—validating cross-linking efficiency, antibody specificity, and final library complexity—is non-negotiable for ChIP-seq experiments aimed at discovering authentic transcription factor binding mechanisms. Integrating these protocols and benchmarks ensures data quality, maximizes research investment, and provides a solid foundation for downstream drug discovery and mechanistic studies.
Beyond the Peak: Validating ChIP-seq Findings and Navigating the Modern Genomic Toolkit
In the context of ChIP-seq research for discovering transcription factor (TF) binding mechanisms, initial high-throughput data requires rigorous validation. ChIP-seq identifies putative genomic binding sites, but these findings must be confirmed using orthogonal methods—techniques based on differing physical or biochemical principles. This whitepaper details three core validation methodologies: Electrophoretic Mobility Shift Assay (EMSA), Luciferase Reporter Assays, and quantitative PCR (qPCR). Their combined use provides a multi-layered, robust confirmation of protein-DNA interactions and functional consequences, which is critical for downstream drug discovery and mechanistic biology.
Orthogonal Validation in the ChIP-seq Workflow
ChIP-seq generates genome-wide maps of TF occupancy. However, potential artifacts from antibody specificity, sequencing biases, and bioinformatic peak-calling necessitate validation. The selected methods offer complementary insights:
- EMSA: Confirms direct, sequence-specific TF-DNA binding in vitro.
- Luciferase Reporter Assay: Assesses the functional transcriptional outcome of a TF binding to a candidate cis-regulatory element.
- qPCR: Quantifies the enrichment of specific genomic regions from ChIP material, bridging the high-throughput data with targeted confirmation.
These methods form an essential triad for moving from discovery to validated mechanism.
Method 1: Electrophoretic Mobility Shift Assay (EMSA)
EMSA, or gel shift assay, is a classic in vitro technique to detect direct binding of a protein to a specific DNA or RNA sequence.
Detailed Protocol
- Probe Preparation: A DNA fragment (typically 20-50 bp) containing the putative TF binding motif identified by ChIP-seq is labeled with a fluorophore or biotin.
- Protein Preparation: Nuclear extract containing the TF of interest or a purified/recombinant TF protein is prepared.
- Binding Reaction: The labeled probe is incubated with the protein extract in a binding buffer (containing MgCl₂, DTT, glycerol, and non-specific competitor DNA like poly(dI-dC)) for 20-30 minutes at room temperature.
- Electrophoresis: The reaction mixture is loaded onto a non-denaturing polyacrylamide gel. Protein-bound DNA migrates more slowly than free DNA, resulting in a shifted band.
- Detection: The gel is imaged to visualize shifted (bound) vs. free probe bands. Specificity is confirmed via competition with excess unlabeled probe (cold competition) or supershift using an antibody against the TF.
Key Research Reagent Solutions
| Item | Function |
|---|---|
| Biotin- or Fluorophore-labeled DNA Oligos | Provides sensitive, non-radioactive detection of the target DNA probe. |
| Non-specific Competitor DNA (e.g., poly(dI-dC)) | Blocks non-specific protein-DNA interactions to reduce background. |
| Non-denaturing Polyacrylamide Gel | Matrix that separates protein-DNA complexes from free DNA based on size/charge. |
| Chemiluminescent or Fluorescent Detection Kits | For visualizing the shifted bands after electrophoretic separation. |
| TF-specific Antibody | For supershift assays to confirm the identity of the binding protein. |
Method 2: Luciferase Reporter Assay
This functional assay measures the transcriptional activity of a DNA sequence (e.g., a putative enhancer/promoter from a ChIP-seq peak) by linking it to a reporter gene.
Detailed Protocol
- Reporter Construct Cloning: The genomic region of interest is cloned upstream of a minimal promoter driving the firefly luciferase gene in a plasmid vector.
- Cell Transfection: Cultured cells are co-transfected with:
- The experimental reporter construct.
- A Renilla luciferase control plasmid (for normalization of transfection efficiency).
- An expression plasmid for the TF of interest (or siRNA for knockdown studies).
- Incubation & Lysis: Cells are incubated for 24-48 hours to allow gene expression, then lysed.
- Dual-Luciferase Measurement: Using a luminometer, firefly luciferase activity (experimental signal) and Renilla luciferase activity (control signal) are measured sequentially from the same sample. The ratio of Firefly to Renilla luminescence indicates the transcriptional activity of the inserted sequence.
Key Research Reagent Solutions
| Item | Function |
|---|---|
| Dual-Luciferase Reporter Assay System | Provides optimized buffers and substrates for sequential measurement of both luciferases. |
| Transfection Reagent (Lipid-based or Electroporation) | Enables efficient delivery of plasmid DNA into cultured cells. |
| Renilla Luciferase Control Vector (e.g., pRL-TK/SV40) | Serves as an internal control to normalize for variations in transfection and cell viability. |
| Luminometer | Instrument required for sensitive detection of luminescent signals. |
| Plasmid Miniprep/Maxiprep Kits | For high-quality, endotoxin-free plasmid DNA preparation crucial for transfection. |
Method 3: Quantitative PCR (qPCR) for ChIP Validation
qPCR is the most direct method to validate specific genomic regions enriched in a ChIP experiment, providing quantitative comparison between immunoprecipitated and input DNA samples.
Detailed Protocol
- ChIP Sample Preparation: After performing ChIP, the purified DNA (from both the IP and the input control) is used as the template.
- Primer Design: Sequence-specific primers (amplicon size 80-150 bp) are designed flanking the summit of the ChIP-seq peak (test region) and in a genomic region predicted not to bind the TF (negative control region).
- qPCR Reaction Setup: SYBR Green or TaqMan-based qPCR reactions are prepared with the ChIP DNA, primers, and master mix.
- Amplification & Quantification: The PCR cycle at which fluorescence crosses a threshold (Ct) is measured for each sample. The fold-enrichment is calculated using the ΔΔCt method relative to the input sample and the negative control region.
Key Research Reagent Solutions
| Item | Function |
|---|---|
| SYBR Green or TaqMan qPCR Master Mix | Contains optimized buffer, polymerase, dNTPs, and dye for quantitative amplification. |
| ChIP-Validated qPCR Primers | Target-specific primers with high efficiency and specificity for the genomic regions of interest. |
| 96- or 384-well qPCR Plates & Seals | Optical-grade plates compatible with real-time PCR instruments. |
| Real-Time PCR Instrument | Thermocycler with optical detection capabilities for measuring fluorescence during amplification. |
Data Presentation: Comparative Analysis of Methods
Table 1: Core Characteristics of Orthogonal Validation Methods
| Method | Principle | Readout | Throughput | Key Strength | Primary Limitation |
|---|---|---|---|---|---|
| EMSA | Protein-DNA binding affinity | Gel shift / band intensity | Low | Confirms direct, specific binding in vitro | Non-physiological conditions; no functional data. |
| Luciferase Assay | Transcriptional activation | Luminescence (Relative Light Units) | Medium | Measures functional consequence of binding in cells. | Results can be influenced by episomal plasmid context. |
| ChIP-qPCR | Genomic locus enrichment | Ct value / Fold-Enrichment | Medium-High | Quantitatively validates in vivo binding from native chromatin. | Requires high-quality ChIP; does not prove direct binding or function. |
Table 2: Typical Experimental Parameters and Outputs
| Method | Typical Assay Duration | Sample Type | Quantitative Output | Common Validation Controls |
|---|---|---|---|---|
| EMSA | 1-2 days | Purified protein / nuclear extract | Band density shift | Cold competition, mutant probe, supershift. |
| Luciferase Assay | 3-4 days | Cultured cell lysate | Fold-change vs. control | Empty vector, mutant enhancer, Renilla normalization. |
| ChIP-qPCR | 1 day | ChIP DNA | % Input or Fold-Enrichment | IgG control, negative genomic region, input DNA dilution series. |
Integrated Workflow for ChIP-seq Validation
The logical progression from ChIP-seq discovery to orthogonal validation is depicted below.
Diagram 1: Orthogonal validation workflow for ChIP-seq findings.
The integration of EMSA, Luciferase Reporter Assays, and qPCR provides a robust, multi-faceted framework for validating ChIP-seq-derived hypotheses on transcription factor binding. Each method addresses a distinct question—from direct binding and in vivo occupancy to transcriptional regulation. For researchers and drug developers, this orthogonal approach is non-negotiable for converting genomic observations into reliable mechanistic understanding and actionable therapeutic targets.
In the context of a broader thesis on ChIP-seq's role in discovering transcription factor (TF) binding mechanisms, selecting the appropriate chromatin immunoprecipitation (ChIP) technology is critical. Each method—ChIP-qPCR, ChIP-chip, and ChIP-seq—offers distinct advantages and constraints for researchers and drug development professionals profiling protein-DNA interactions. This technical guide provides a comparative analysis of these core methodologies.
Core Methodologies & Protocols
Chromatin Immunoprecipitation (ChIP) Core Protocol
This foundational protocol is common to all three analytical techniques.
- Step 1: Crosslinking. Treat cells with formaldehyde (typically 1%) to covalently link proteins to DNA.
- Step 2: Cell Lysis & Chromatin Shearing. Lyse cells and fragment chromatin via sonication or enzymatic digestion to 200-600 bp fragments.
- Step 3: Immunoprecipitation. Incubate chromatin with a specific, antibody-coated bead to capture the protein-DNA complex.
- Step 4: Reverse Crosslinking & Purification. Heat to reverse crosslinks, then use proteinase K to digest proteins, leaving purified DNA.
- Step 5: Analysis. The purified DNA (the "immunoprecipitate" or IP) is analyzed via qPCR, microarray (chip), or sequencing (seq).
ChIP-qPCR Analysis Protocol
- Step 1: Design and validate sequence-specific primers for target genomic regions (e.g., suspected TF binding sites).
- Step 2: Perform quantitative PCR (qPCR) on the IP DNA and a reference input DNA sample.
- Step 3: Calculate enrichment using the percent input method or fold-enrichment relative to a control region.
ChIP-chip Analysis Protocol
- Step 1: Amplify the IP DNA (often by ligation-mediated PCR) and label with a fluorescent dye (e.g., Cy5).
- Step 2: Label a reference input DNA sample with a different dye (e.g., Cy3).
- Step 3: Co-hybridize labeled samples to a DNA microarray (chip) containing genomic probes.
- Step 4: Scan arrays, normalize fluorescence ratios, and identify enriched regions.
ChIP-seq Analysis Protocol
- Step 1: Prepare a sequencing library from IP DNA: end-repair, adenylate, ligate adapters, and PCR-amplify.
- Step 2: Perform high-throughput sequencing (e.g., Illumina NGS).
- Step 3: Align sequence reads to a reference genome.
- Step 4: Call peaks using algorithms (e.g., MACS2) to identify statistically significant enrichment sites.
Table 1: Comparative Strengths and Limitations
| Feature | ChIP-qPCR | ChIP-chip | ChIP-seq |
|---|---|---|---|
| Throughput | Low (≤ 100 regions) | Medium (genome-wide, but limited by array) | High (entire genome) |
| Resolution | High (single base-pair for primer site) | Medium (Limited by probe spacing, ~30-100 bp) | High (single base-pair) |
| Dynamic Range | High (≥ 10^7) | Low (~10^3) | Very High (~10^5) |
| Prior Knowledge Required | Yes (candidate regions) | Yes (for array design) | No (discovery tool) |
| Genome Coverage | Targeted sites only | Defined by array; poor for repetitive regions | Comprehensive, includes repeats |
| Sample Required | Low (100-1000 cells possible) | High (μg of DNA) | Medium (ng of DNA) |
| Primary Cost | Low per sample | Medium per array | High per sample (decreasing) |
| Analysis Complexity | Low | Medium | High (bioinformatics intensive) |
| Best For | Validating candidate sites; few targets | Genomic profiling when sequencing is unavailable | De novo discovery; genome-wide mapping |
Table 2: Typical Quantitative Performance Metrics
| Metric | ChIP-qPCR | ChIP-chip | ChIP-seq |
|---|---|---|---|
| Typical Input Material | 10^3 - 10^5 cells | 1-10 μg DNA | 1-10 ng DNA (10^5 - 10^6 cells) |
| Run Time (Post-ChIP) | 2-4 hours | 3-5 days | 2-5 days |
| Peak/Region Detection Limit | N/A (user-defined) | ~500-1000 binding sites | > 10,000 binding sites |
| Common Replicates | 3 (technical) | 2-3 (biological) | 2-3 (biological) |
Visualizations
Title: ChIP Technology Decision Workflow
Title: Decision Logic for ChIP Method Selection
The Scientist's Toolkit: Key Research Reagent Solutions
Table 3: Essential Materials for ChIP Experiments
| Item | Function | Key Considerations |
|---|---|---|
| Specific Antibody | Immunoprecipitates the target protein (TF, histone mark). | Critical: Must be ChIP-grade/validated; primary source of failure. |
| Protein A/G Magnetic Beads | Binds antibody-protein-DNA complex for separation. | Efficiency varies by antibody host species; reduce background. |
| Formaldehyde (1%) | Reversible crosslinker fixing protein to DNA. | Crosslinking time is target-dependent (2-30 min). |
| Sonication Device | Shears chromatin to 200-600 bp fragments. | Must be optimized; over-shearing destroys epitopes. |
| Micrococcal Nuclease (MNase) | Enzymatic alternative to sonication for shearing. | Yields nucleosome-sized fragments; good for histones. |
| ChIP-qPCR Primers | Amplify specific genomic regions for quantification. | Must be validated for efficiency; control primers essential. |
| DNA Library Prep Kit | For ChIP-seq: prepares DNA for NGS adapter ligation. | Low-input kits are crucial for limited samples. |
| High-Sensitivity DNA Assay | Quantifies low-yield ChIP DNA (e.g., Bioanalyzer, Qubit). | Critical before qPCR, chip, or seq library prep. |
The discovery and profiling of transcription factor (TF) binding sites are fundamental to understanding gene regulatory networks. For over a decade, Chromatin Immunoprecipitation followed by sequencing (ChIP-seq) has been the cornerstone technique in this field, enabling genome-wide mapping of protein-DNA interactions. However, ChIP-seq is limited by its requirement for large cell numbers, crosslinking artifacts, and high background noise. This whitepaper, framed within the broader thesis on advancing ChIP-seq methodologies for TF mechanism discovery, provides an in-depth technical comparison of two revolutionary techniques: CUT&RUN and CUT&Tag. These methods offer superior resolution, sensitivity, and efficiency for TF profiling, particularly in low-input and single-cell contexts.
Core Principles & Methodological Comparison
Detailed Experimental Protocols
CUT&RUN (Cleavage Under Targets & Release Using Nuclease)
- Cell Preparation: Permeabilize cells or nuclei immobilized on Concanavalin A-coated magnetic beads.
- Antibody Incubation: Incubate with a primary antibody specific to the target transcription factor (e.g., anti-CTCF).
- pA-MNase Fusion Protein Binding: Add Protein A-Micrococcal Nuclease (pA-MNase) fusion protein, which binds to the primary antibody.
- Activation and Cleavage: Induce targeted chromatin cleavage by adding Ca²⁺ to activate MNase. This releases TF-bound DNA fragments into the supernatant.
- DNA Extraction: Stop the reaction with EGTA, extract DNA from the supernatant, and purify.
- Library Prep & Sequencing: Construct sequencing libraries from the low-background, specifically cleaved DNA fragments.
CUT&Tag (Cleavage Under Targets & Tagmentation)
- Cell Preparation: Permeabilize cells or nuclei immobilized on Concanavalin A-coated beads.
- Primary & Secondary Antibody Incubation: Sequentially incubate with a primary antibody against the TF, followed by a secondary antibody (e.g., anti-rabbit).
- pA-Tn5 Fusion Protein Binding: Add a Hyperactive Tn5 transposase pre-loaded with sequencing adapters (pA-Tn5), which binds to the secondary antibody.
- Tagmentation: Add Mg²⁺ to activate Tn5, which simultaneously cleaves and tags the target chromatin regions with sequencing adapters in situ.
- Fragment Release & Amplification: Extract and purify the tagged DNA fragments. Perform a PCR amplification using the added adapters to generate the final sequencing library.
Quantitative Data Comparison
Table 1: Technical and Performance Comparison for TF Profiling
| Feature | ChIP-seq | CUT&RUN | CUT&Tag |
|---|---|---|---|
| Starting Material | 10⁵ - 10⁷ cells | 10² - 10⁵ cells | 10² - 10⁵ cells (up to single-cell) |
| Background Noise | High (crosslinking artifacts) | Very Low | Lowest (in situ tagmentation) |
| Resolution | ~100-200 bp | ~10-50 bp (sharp cleavage) | ~10-50 bp (sharp tagmentation) |
| Hands-on Time | 2-4 days | 1-2 days | 1-2 days |
| Sequencing Depth | ~20-40 million reads | ~2-10 million reads | ~1-5 million reads |
| Key Advantage | Established, wide antibody use | Low background, clean signal | Highest sensitivity, direct library prep |
| Main Limitation | High input, crosslinking | Membrane permeabilization critical | Optimization of Tn5 concentration needed |
Table 2: Typical Experimental Outcomes for a Common TF (e.g., CTCF)
| Metric | ChIP-seq | CUT&RUN | CUT&Tag |
|---|---|---|---|
| Fraction of Reads in Peaks (FRiP) | 1-10% | 30-80% | 50-90% |
| Peak Concordance | Reference (100%) | >90% | >90% |
| Signal-to-Noise Ratio | Low | High | Very High |
Visualizing the Workflows
CUT&RUN Experimental Workflow
CUT&Tag Experimental Workflow
The Scientist's Toolkit: Research Reagent Solutions
Table 3: Essential Materials for CUT&RUN and CUT&Tag Experiments
| Reagent/Material | Function | Example/Note |
|---|---|---|
| Concanavalin A Magnetic Beads | Immobilizes permeabilized cells/nuclei for all subsequent steps. | Essential for both protocols. |
| Digitonin | A detergent used to permeabilize cellular and nuclear membranes, allowing antibody and enzyme entry. | Concentration is critical (typically 0.01-0.1%). |
| Target-Specific Primary Antibody | Binds specifically to the transcription factor of interest. | Must be validated for ChIP or CUT&Tag/CUT&RUN; key to success. |
| Protein A-Micrococcal Nuclease (pA-MNase) | CUT&RUN-specific fusion enzyme. Binds antibody, cleaves DNA upon Ca²⁺ activation. | Often purified in-house or obtained from core facilities. |
| pA-Tn5 Transposase | CUT&Tag-specific fusion enzyme. Pre-loaded with sequencing adapters, binds antibody, performs tagmentation. | Commercially available (e.g., from Epicypher). |
| Sequencing Adapters | Oligonucleotides that become ligated to DNA fragments, enabling amplification and sequencing. | Pre-loaded on Tn5 for CUT&Tag; added during library prep for CUT&RUN. |
| EGTA (for CUT&RUN) | A calcium chelator. Stops MNase activity by sequestering Ca²⁺ ions. | Added after controlled cleavage. |
| SDS & Proteinase K | Used in DNA purification to digest proteins and release DNA fragments. | Common to both protocols post-cleavage/tagmentation. |
| SPRI Beads | Magnetic beads for size selection and purification of DNA fragments post-extraction. | Used for clean-up and library preparation. |
CUT&RUN and CUT&Tag represent paradigm shifts in epigenomic profiling, directly addressing the limitations of ChIP-seq. For researchers and drug development professionals investigating TF binding mechanisms, these techniques offer a compelling combination of low-input capability, exceptional signal-to-noise ratios, and high-resolution mapping. CUT&Tag, with its integrated tagmentation, is particularly powerful for ultra-high-throughput and single-cell applications, while CUT&RUN provides a robust and slightly more established alternative. The choice between them hinges on specific experimental needs, but both significantly advance the core thesis of refining our approach to discovering and validating transcription factor binding landscapes, thereby accelerating target identification and validation in therapeutic development.
Chromatin Immunoprecipitation followed by sequencing (ChIP-seq) has been the cornerstone for mapping in vivo transcription factor (TF) binding sites and histone modifications, providing critical insights into gene regulatory mechanisms for drug target discovery. However, ChIP-seq has inherent limitations: it requires high-quality, specific antibodies, large cell numbers, and provides a static snapshot of protein-DNA interactions without direct, genome-wide readout of underlying chromatin accessibility. This thesis posits that Assay for Transposase-Accessible Chromatin using sequencing (ATAC-seq) is not merely an alternative but a transformative complementary approach. It addresses ChIP-seq's limitations by offering a rapid, sensitive, low-input assay for open chromatin mapping and, through computational footprinting, inferring TF occupancy at nucleotide resolution, thereby refining and expanding our understanding of TF binding mechanisms derived from ChIP-centric studies.
Core Methodologies and Protocols
Standard ATAC-seq Wet-Lab Protocol
- Cell Lysis: Isolate 50,000-100,000 viable cells. Wash with cold PBS. Lyse with cold lysis buffer (10 mM Tris-HCl pH 7.4, 10 mM NaCl, 3 mM MgCl2, 0.1% Igepal CA-630) to isolate nuclei.
- Tagmentation: Resuspend nuclei in transposase reaction mix (Illumina Tagmentase TDE1, Tagmentation Buffer). Incubate at 37°C for 30 minutes to simultaneously fragment and tag open chromatin regions with sequencing adapters.
- DNA Purification: Clean up tagmented DNA using a silica membrane-based PCR purification kit.
- Library Amplification & Indexing: Amplify the library with 10-12 cycles of PCR using indexed primers. Perform a double-sided SPRI bead cleanup (e.g., 0.5x followed by 1.3x ratio) to size-select fragments primarily below 1kb.
- Sequencing: Perform paired-end sequencing (e.g., 2x50 bp) on an Illumina platform. A sequencing depth of 50-100 million reads per sample is recommended for robust footprinting analysis.
Computational Pipeline for TF Footprinting from ATAC-seq Data
- Preprocessing & Alignment: Trim adapters (Trim Galore!). Align reads to a reference genome (hg38/mm10) using a splice-aware aligner (BWA-MEM, Bowtie2). Remove PCR duplicates (samtools rmdup).
- Peak Calling & Accessibility Analysis: Call broad regions of open chromatin (peaks) using MACS2 in
--nomodelmode. Generate a normalized, smoothed track of insertions per base pair (BigWig file). - Footprint Extraction: Identify positions of protected "dips" in the Tn5 insertion profile within peaks. Common tools include:
- HINT-ATAC: Uses a hidden Markov model to segment the accessibility signal into footprint and non-footprint states.
- TOBIAS: Corrects for Tn5 insertion sequence bias, calculates footprint scores, and infers bound/unbound TF motifs.
- Motif Analysis & TF Inference: Intersect footprint positions with known TF motif databases (JASPAR, CIS-BP). Use tools like MEME-ChIP or HOMER to perform de novo motif discovery within footprints. Integrate ChIP-seq peak data to validate and prioritize TFs.
Table 1: Comparison of ChIP-seq and ATAC-seq for TF Binding Studies
| Feature | ChIP-seq | ATAC-seq (+ Footprinting) |
|---|---|---|
| Primary Output | Protein-DNA interaction sites | Genome-wide chromatin accessibility |
| Sample Input | 1-10 million cells | 50,000-100,000 cells |
| Time to Library | 3-5 days | ~3 hours |
| Antibody Required | Yes (highly specific) | No |
| Resolution | 100-200 bp (peak) | Single-base pair (insertion site/footprint) |
| Key Advantage | Direct measurement of in vivo binding | Unbiased, fast, low-input; infers multiple TFs |
| Key Limitation | Antibody dependency & availability | Indirect inference of TF binding; footprint depth required >50M reads |
Table 2: Performance Metrics of ATAC-seq Footprinting Algorithms (Theoretical Benchmark)
| Tool | Core Algorithm | Corrects Tn5 Bias | Output | Typical Required Depth |
|---|---|---|---|---|
| HINT-ATAC | Hidden Markov Model | Yes | Footprint locations, scores | > 50M paired-end reads |
| TOBIAS | Footprint score (Z-score) | Yes | Bound/unbound motif scores | > 50M paired-end reads |
| PIQ | PWM-based regression | No | TF binding probability | > 30M reads |
| Wellington | DNaseI footprint-like | No | Significant footprint regions | > 100M reads |
The Scientist's Toolkit: Research Reagent Solutions
Table 3: Essential Materials for Integrated ChIP-seq/ATAC-seq Studies
| Item | Function | Example Product |
|---|---|---|
| Nextera Tn5 Transposase | Enzyme for simultaneous fragmentation and tagging of open chromatin. | Illumina Tagmentase TDE1 (20034197) |
| SPRIselect Beads | Size selection and cleanup of tagmented DNA; critical for removing mitochondrial fragments. | Beckman Coulter SPRIselect (B23318) |
| Cell Permeabilization Buffer | Gentle lysis to isolate intact nuclei for tagmentation. | 10x Genomics Nuclei Buffer (2000153) |
| Magnetic Protein A/G Beads | Immunoprecipitation of TF-DNA complexes for ChIP-seq validation. | Dynabeads Protein A/G (10001D/10003D) |
| High-Sensitivity DNA Assay | Accurate quantification of low-concentration ATAC/ChIP libraries prior to sequencing. | Qubit dsDNA HS Assay Kit (Q32851) |
| Dual-Indexed PCR Primers | For multiplexed, sample-specific library amplification. | Illumina Nextera Index Kit (20018705) |
Visualized Workflows and Relationships
Title: Integrated ATAC-seq Experimental & Computational Workflow
Title: Complementary Relationship Between ChIP-seq and ATAC-seq
1. Introduction
This whitepaper, framed within the broader context of ChIP-seq research for elucidating transcription factor (TF) binding mechanisms, addresses the critical next step: moving from mapping binding events to establishing causal gene regulatory functions. While ChIP-seq robustly identifies genomic loci bound by TFs or marked by histone modifications, it cannot definitively assign regulatory functions to these sites or link them to target genes. This guide details the integration of CRISPR-based perturbation technologies to functionally validate and causally link binding sites to phenotypic outcomes, thereby bridging correlative genomics with causal genetics.
2. From Correlation to Causation: The Experimental Paradigm
The standard workflow begins with ChIP-seq to identify candidate cis-regulatory elements (cCREs), such as enhancers or promoters, bound by a TF of interest. Subsequent steps employ CRISPR tools to perturb these sites and measure downstream molecular and phenotypic consequences.
Table 1: Core Comparative Analysis: ChIP-seq vs. Functional Validation
| Aspect | ChIP-seq (Discovery) | CRISPR Perturbation (Validation) |
|---|---|---|
| Primary Output | Genomic coordinates of protein-DNA interactions. | Functional impact of a specific genomic locus. |
| Causality | Correlative; indicates potential regulatory regions. | Establishes causal links between locus and phenotype. |
| Key Metric | Peak score, fold-enrichment. | Phenotypic effect size (e.g., log2 fold-change in expression). |
| Temporal Resolution | Snapshot of binding at time of fixation. | Can assess function across time courses. |
| Throughput | High (genome-wide). | Variable; from low (individual sites) to high (CRISPR screens). |
3. Key CRISPR Perturbation Modalities
3.1. CRISPR Interference (CRISPRi) and Activation (CRISPRa) These systems use a catalytically dead Cas9 (dCas9) fused to transcriptional repressor (e.g., KRAB) or activator (e.g., VP64-p65-Rta) domains to modulate gene expression without altering DNA sequence.
- Protocol (CRISPRi/a at a putative enhancer):
- Design sgRNAs: Design 3-5 sgRNAs targeting the ChIP-seq peak summit of the candidate enhancer. Include negative control sgRNAs targeting intergenic regions.
- Delivery: Co-transfect or transduce cells with plasmids/viruses expressing dCas9-effector (KRAB or activator) and the target-specific sgRNA.
- Validation: After 72-96 hours, harvest cells for:
- qPCR: Measure expression of the putative target gene(s) and control genes.
- Reporter Assay: Clone the candidate element into a minimal promoter-luciferase vector to confirm enhancer activity.
- Analysis: Normalize expression data to controls. A significant change in target gene expression upon perturbation confirms the element's regulatory role.
3.2. CRISPR/Cas9 Nuclease-Mediated Deletion This method permanently deletes genomic regions to assess the necessity of a cCRE.
- Protocol (Enhancer Deletion):
- Design gRNAs: Design two sgRNAs flanking the ChIP-seq-defined region (typically 500bp - 2kb). Verify off-target potential.
- Generate Clonal Lines: Transfect cells with Cas9 and sgRNA plasmids. Single-cell clone and expand.
- Genotype: PCR-amplify the target locus from clonal genomic DNA. Sanger sequence to identify homozygous or heterozygous deletions.
- Phenotypic Assessment: Measure transcript levels (e.g., RNA-seq) of candidate target genes in deletion vs. wild-type clones.
4. Scaling Up: CRISPR Screening of Regulatory Elements
Pooled CRISPR screening enables high-throughput functional assessment of hundreds to thousands of cCREs identified by ChIP-seq.
- Protocol (Pooled CRISPRi Screen for Essential Enhancers):
- Library Design: Synthesize a pooled sgRNA library targeting peak regions from ChIP-seq data (e.g., 5 sgRNAs per peak) with non-targeting control sgRNAs.
- Viral Production: Package the sgRNA library into lentivirus at low MOI to ensure single integration.
- Cell Infection & Selection: Infect cells stably expressing dCas9-KRAB at a coverage of >500 cells per sgRNA. Select with puromycin.
- Phenotypic Selection: Passage cells for 14-21 population doublings. Harvest genomic DNA at baseline (T0) and endpoint (Tfinal).
- Sequencing & Analysis: PCR-amplify integrated sgRNA sequences, sequence on an Illumina platform. Quantify sgRNA depletion/enrichment between T0 and Tfinal using tools like MAGeCK. Depleted sgRNAs indicate target regulatory elements essential for cell growth.
5. The Scientist's Toolkit: Research Reagent Solutions
Table 2: Essential Reagents for Functional Validation of Binding Sites
| Reagent / Solution | Function / Explanation |
|---|---|
| dCas9-KRAB Expression System | Lentiviral or plasmid vector for stable, inducible expression of the core CRISPRi repressor. |
| dCas9-VPR Expression System | Vector for CRISPRa, containing the strong synthetic activator VPR (VP64-p65-Rta). |
| Pooled sgRNA Library | Custom-designed, synthesized oligonucleotide library targeting candidate cCREs from ChIP-seq data. |
| Next-Generation Sequencing (NGS) Kits | For library preparation and deep sequencing of sgRNA representations in pooled screens. |
| High-Fidelity PCR Master Mix | For accurate amplification of genomic regions for deletion genotyping and sgRNA recovery. |
| Chromatin Accessibility Assay Kit (ATAC-seq) | To confirm perturbation alters local chromatin state at the targeted cCRE. |
| Single-Cell RNA-seq Platform | To dissect heterogeneous transcriptional consequences of cCRE perturbation in complex cell populations. |
6. Data Integration and Pathway Analysis
Integrating perturbation data with original ChIP-seq datasets is crucial. For example, overlaying genes whose expression changes upon enhancer deletion with ChIP-seq peaks can reveal direct vs. indirect effects.
Diagram 1: Core Workflow: ChIP-seq to CRISPR Validation
Diagram 2: CRISPR Modalities for Functional Validation
Diagram 3: Pooled CRISPR Screen for Regulatory Elements
7. Conclusion
The integration of ChIP-seq discovery with CRISPR-based functional perturbation represents a definitive framework for moving beyond mapping toward mechanistic understanding in gene regulation. By applying the protocols and strategies outlined, researchers can rigorously assign causal regulatory functions to binding sites, accelerating target validation in both basic research and drug development pipelines.
Conclusion
ChIP-seq remains an indispensable cornerstone for elucidating the mechanistic underpinnings of transcription factor binding and gene regulation. Mastering its foundational principles, methodological nuances, and optimization strategies is critical for generating biologically meaningful data. As outlined, successful application requires rigorous experimental design, savvy bioinformatic analysis, and robust validation to translate binding sites into functional insights. The future of TF research lies in the strategic integration of ChIP-seq with complementary next-generation technologies like CUT&Tag for low-input samples and single-cell methods for cellular heterogeneity. For biomedical and clinical research, this evolving toolkit empowers the systematic deconvolution of pathogenic regulatory networks, offering unprecedented opportunities to identify novel therapeutic targets and diagnostic biomarkers rooted in the fundamental mechanics of transcriptional control.