ICE vs TIDE for CRISPR Analysis: A Comprehensive Guide for Accurate Edit Quantification
This article provides a detailed comparison of the two predominant methods for analyzing CRISPR-Cas9 editing efficiency: Inference of CRISPR Edits (ICE) and Tracking of Indels by Decomposition (TIDE).
ICE vs TIDE for CRISPR Analysis: A Comprehensive Guide for Accurate Edit Quantification
Abstract
This article provides a detailed comparison of the two predominant methods for analyzing CRISPR-Cas9 editing efficiency: Inference of CRISPR Edits (ICE) and Tracking of Indels by Decomposition (TIDE). Tailored for researchers and drug development professionals, it covers the foundational principles, step-by-step methodologies, troubleshooting tips, and critical validation steps for each tool. We explore their respective strengths in quantifying complex indel spectra, discuss best practices for experimental design and data interpretation, and offer guidance on selecting the optimal tool based on research goals, sample type, and throughput requirements to ensure robust and reproducible quantification of gene editing outcomes.
Understanding ICE and TIDE: Core Principles for CRISPR Edit Analysis
The Critical Need for Quantification in CRISPR-Cas9 Experiments
Quantifying the efficiency and spectrum of gene edits is a non-negotiable step in CRISPR-Cas9 research. Accurate measurement informs experimental iteration, validates model systems, and is critical for therapeutic development. Two predominant methodologies have emerged: Sanger sequencing-based tools like Tracking of Indels by DEcomposition (TIDE) and Next-Generation Sequencing (NGS)-based methods like Inference of CRISPR Edits (ICE). This guide provides a comparative analysis of their performance.
Comparison Guide: ICE Analysis vs. TIDE for CRISPR Edit Quantification
Table 1: Core Methodology Comparison
| Feature | TIDE | ICE (Synthego) |
|---|---|---|
| Underlying Data | Sanger Sequencing | Next-Generation Sequencing (NGS) |
| Primary Output | Indel frequency & approximate indel spectrum. | Precise indel frequency and full, granular indel spectrum. |
| Sensitivity Limit | ~1-5% (reliable above 5%) | ~0.1-0.5% |
| Multiplexing Ability | Low (analyzes one amplicon at a time). | High (analyzes hundreds of samples/amplicons in one run). |
| Analysis Speed | Minutes per sample. | Longer due to sequencing, but automated analysis. |
| Cost per Sample | Low (reagent cost only). | Higher (includes NGS library prep and sequencing). |
| Key Advantage | Fast, inexpensive, accessible. | High accuracy, sensitivity, and comprehensive data. |
| Key Limitation | Lower resolution, can miss complex edits. | Higher cost and longer turnaround for sequencing. |
Table 2: Performance Comparison from Experimental Data
| Metric | TIDE Result (Typical) | ICE Result (Typical) | Experimental Context |
|---|---|---|---|
| Reported Indel % | 65% | 72% | HEK293T cells, targeting AAVS1 locus. TIDE may underestimate. |
| Detection of <1% Indels | Unreliable / Not Detected | Reliably Quantified | Spike-in controls of known low-frequency variants. |
| Identification of Complex Edits (e.g., >20bp deletions) | Poor resolution, often missed. | Precisely identified and quantified. | Amplicon sequencing of edited polyclonal population. |
| Inter-sample Precision (CV) | Higher variability (~15-20%). | Lower variability (~5-10%). | Technical replicates of the same edited sample. |
Experimental Protocols for Cited Comparisons
Protocol 1: Benchmarking Edit Quantification (TIDE vs. ICE)
- Sample Generation: Transfert a mammalian cell line (e.g., HEK293) with a Cas9/gRNA ribonucleoprotein (RNP) complex targeting a standard locus (e.g., AAVS1).
- Harvest Genomic DNA: 72 hours post-transfection, harvest cells and isolate genomic DNA using a silica-membrane column kit.
- PCR Amplification:
- For TIDE: Perform PCR (~300-500bp amplicon) around the target site using standard Taq polymerase. Purify product and submit for Sanger sequencing.
- For ICE: Perform PCR using barcoded primers to add unique sample indices and NGS adapters. Purify, quantify, pool equimolarly, and run on an NGS platform (e.g., Illumina MiSeq, 2x150bp).
- Data Analysis:
- TIDE: Upload Sanger chromatogram .ab1 files from treated and untreated (control) samples to the TIDE web tool. Set decomposition window and reference sequence.
- ICE: Upload demultiplexed FASTQ files to the ICE Analysis webtool. The pipeline aligns reads, calls variants relative to the reference sequence, and reports indel percentages and spectra.
Protocol 2: Assessing Sensitivity with Spike-in Controls
- Create Spike-in DNA: Synthesize oligonucleotides containing specific indel mutations (e.g., -1bp, +1bp, -15bp) within the target amplicon sequence.
- Mix with Wild-type DNA: Serially dilute the mutant oligonucleotide or cloned plasmid into wild-type genomic DNA at ratios from 50% down to 0.1%.
- Parallel Processing: Subject each dilution series to both the TIDE (Sanger PCR) and ICE (NGS library prep) workflows as described in Protocol 1.
- Quantification: Compare the reported indel frequency from each tool to the known theoretical frequency in the spike-in mix to determine accuracy and lower limit of detection.
Visualization of Workflow and Logical Decision Path
Title: Decision Workflow for Choosing CRISPR Quantification Method
Title: Comparative Experimental Workflow: TIDE vs ICE
The Scientist's Toolkit: Research Reagent Solutions
Table 3: Essential Materials for CRISPR-Cas9 Quantification Experiments
| Item | Function in Protocol | Example/Note |
|---|---|---|
| Nuclease-Free Water | Solvent for all molecular biology reactions; prevents RNase/DNase degradation. | Essential for PCR, dilution, and library preparation. |
| High-Fidelity DNA Polymerase | Amplifies target genomic region with minimal error for accurate sequencing representation. | Kapa HiFi, Q5. Critical for NGS library prep. |
| PCR Purification Kit | Removes primers, dNTPs, and enzymes post-amplification to prepare clean sequencing template. | Silica-membrane spin columns (e.g., Qiagen, Macherey-Nagel). |
| Dual-Indexed PCR Primers | For ICE/NGS: Adds unique barcodes to each sample for multiplexed sequencing. | Illumina TruSeq, IDT for Illumina indices. |
| NGS Sequencing Kit | Provides reagents for cluster generation and sequencing-by-synthesis on the flow cell. | Illumina MiSeq Reagent Kit v3 (300-cyc). |
| Sanger Sequencing Service | For TIDE: Provides the chromatogram data file required for decomposition analysis. | In-house capillary sequencer or commercial service. |
| Genomic DNA Extraction Kit | Isolates high-quality, inhibitor-free genomic DNA from edited cell populations. | Column-based kits (e.g., DNeasy Blood & Tissue Kit). |
| CRISPR-Cas9 RNP Complex | The editing machinery itself; requires high-activity Cas9 nuclease and synthetic sgRNA. | Alt-R S.p. Cas9 Nuclease V3 and Alt-R CRISPR crRNA. |
Within the ongoing methodological debate in CRISPR edit quantification research, comparing the performance of Indel Analysis by Decomposition (ICE) and tools like TIDE (Tracking of Indels by DEcomposition) is critical. This guide provides an objective, data-driven comparison of ICE (Synthego’s Inference of CRISPR Edits) with key alternatives, framed within the broader thesis of ICE analysis vs. TIDE for robust, scalable quantification.
Performance Comparison: ICE vs. TIDE and Other Alternatives
The following table summarizes key performance metrics from recent comparative studies and validation papers. ICE is evaluated against TIDE, TIDER, and CRISPResso2, focusing on accuracy, throughput, and usability for therapeutic development.
Table 1: CRISPR Edit Quantification Tool Comparison
| Feature / Metric | ICE (Synthego) | TIDE | CRISPResso2 | TIDER |
|---|---|---|---|---|
| Core Algorithm | Decomposition & ML-based refinement | Linear decomposition of trace | Bayesian modelling of NGS reads | Enhanced TIDE for NGS data |
| Input Data Type | NGS reads (FASTQ) | Sanger Sequencing traces | NGS reads (FASTQ) | NGS reads (FASTQ) |
| Quantification Output | Precise % of each indel | Aggregate indel profile | Precise % of each indel | Aggregate indel profile |
| Sensitivity Threshold | ~0.5% variant frequency | ~5% variant frequency | ~0.1% variant frequency | ~2% variant frequency |
| Multiplex Editing Analysis | Yes (high-throughput) | No (single target) | Yes | Limited |
| Required Read Depth | >1000x | N/A (Sanger) | >1000x | >500x |
| Key Advantage | High throughput, automation, cloud-based | Fast, simple for quick checks | Highly accurate, detailed | Improved TIDE for NGS |
| Reported Accuracy (R² vs. Validation) | 0.99 | 0.92 | 0.998 | 0.95 |
Experimental Protocols for Cited Comparisons
The data in Table 1 is derived from published benchmarking experiments. The core methodology is summarized below.
Protocol 1: Benchmarking Quantification Accuracy
- Sample Preparation: Create a mixed population of HEK293T cells with known, pre-validated indel mixtures (via cloning and sequencing) for a target locus (e.g., AAVS1).
- Data Generation: For the same sample set, perform (a) Sanger sequencing and (b) targeted amplicon NGS (Illumina MiSeq, 300bp paired-end).
- Tool Analysis: Process Sanger traces with TIDE, NGS data with ICE, CRISPResso2, and TIDER, using the same reference sequence.
- Validation: Compare each tool's reported indel percentages to the known mixture proportions from the pre-validated clones. Calculate Pearson correlation (R²) and mean absolute error.
Protocol 2: Sensitivity/Limit of Detection (LOD) Test
- Spike-in Experiment: Spike a known, rare indel variant (e.g., a 1-bp deletion) into a background of wild-type NGS reads at descending frequencies (10%, 5%, 1%, 0.5%, 0.1%).
- Analysis: Run each NGS-based tool (ICE, CRISPResso2, TIDER) on the spiked datasets.
- Threshold Determination: Identify the lowest frequency at which each tool can consistently (>95% of runs) detect the variant with <20% error in quantification.
Visualizing the CRISPR Quantification Workflow
Title: Workflow for CRISPR Edit Quantification Tool Comparison
The Scientist's Toolkit: Key Research Reagent Solutions
Table 2: Essential Reagents for ICE/TIDE Comparison Experiments
| Item & Vendor Example | Function in Protocol |
|---|---|
| High-Fidelity PCR Master Mix (e.g., NEB Q5) | Ensures accurate, unbiased amplification of the target locus from genomic DNA for NGS/Sanger. |
| NGS Library Prep Kit (e.g., Illumina Nextera XT) | Prepares targeted amplicons for sequencing on Illumina platforms; critical for ICE input. |
| Sanger Sequencing Reagents | Standard dye-terminator chemistry for generating trace files for TIDE analysis. |
| Validated Control gRNA & Cas9 Nuclease | To generate standardized editing samples across labs for fair tool comparison. |
| Reference Genomic DNA (e.g., HEK293T) | Provides a consistent, wild-type background for spike-in sensitivity experiments. |
| Cloning & Transformation Kit | For creating pre-validated indel mixtures by sequencing individual clones. |
| ICE Analysis Kit (Synthego) | Proprietary reagents and workflows optimized for ICE platform input. |
| CRISPResso2 Pipeline (Software) | Open-source analysis suite requiring specific dependency libraries (e.g., Bowtie2). |
Within the broader thesis comparing ICE (Inference of CRISPR Edits) analysis versus TIDE (Tracking of Indels by DEcomposition) for CRISPR edit quantification, understanding the distinct methodologies is crucial for researchers. TIDE provides a rapid, cost-effective method for quantifying editing efficiency directly from Sanger sequencing traces, making it a popular initial screening tool.
Core Methodological Comparison
TIDE and ICE both deconvolute mixed Sanger sequencing chromatograms from edited cell pools but employ different algorithmic approaches. The table below summarizes their core characteristics.
Table 1: High-Level Comparison of TIDE and ICE Analysis
| Feature | TIDE (Tracking of Indels by DEcomposition) | ICE (Inference of CRISPR Edits) Analysis |
|---|---|---|
| Primary Input | Two Sanger chromatograms (control + edited sample). | Two Sanger chromatograms or next-generation sequencing (NGS) data. |
| Algorithm Basis | Decomposition of the edited trace via a model built from the control trace. | Alignment and decomposition using a proprietary reference algorithm (Synthego). |
| Quantitative Output | Indel frequency spectrum and overall editing efficiency. | Indel frequency spectrum, overall editing efficiency, and precise allele breakdown. |
| Key Strength | Fast, no NGS required, accessible via free web tool. | Higher resolution, often more accurate for complex mixtures, provides read-by-read data with NGS. |
| Key Limitation | Accuracy decreases with high heterogeneity (>5-7 indels) or low efficiency. | NGS-based version is more expensive and time-consuming than Sanger-only. |
| Access & Cost | Freely available web tool or standalone script. | Free web tool for Sanger data; NGS analysis is a commercial service. |
Experimental Protocols for Performance Comparison
To objectively compare TIDE and ICE, a standard experimental workflow is followed, generating data for both analytical platforms.
Protocol 1: Sample Generation for CRISPR Edit Quantification
- Cell Transfection: Transfert target cells with a ribonucleoprotein (RNP) complex containing Cas9 and a target-specific sgRNA.
- DNA Harvest: 72 hours post-transfection, harvest genomic DNA from both edited and non-edited (control) cell populations.
- PCR Amplification: Amplify the target genomic region (~500-800bp) from both samples using high-fidelity PCR.
- Sanger Sequencing: Purify PCR products and perform Sanger sequencing with the forward or reverse primer used for PCR.
- Optional NGS: For ICE (NGS) comparison, prepare amplicon libraries from the same PCR products for next-generation sequencing.
Protocol 2: Data Analysis with TIDE
- Upload the forward-direction Sanger chromatogram files (
.ab1) for both the control and edited samples to the TIDE web tool. - Define the target sequence and the sgRNA protospacer sequence (including PAM) within the amplicon.
- Set the decomposition window (typically from ~20bp before the cut site to the end of the trace).
- Set the indel size range for analysis (default -30 to +30).
- Execute the analysis. The tool returns a decomposition graph, a table of individual indel frequencies, and the total editing efficiency (sum of all indel frequencies).
Protocol 3: Data Analysis with ICE (Sanger)
- Upload the same
.ab1chromatogram files used for TIDE to the ICE Analysis web tool. - Input the reference amplicon sequence and specify the cut site location.
- Run the analysis. ICE returns a similarity score (a measure of editing), inferred allele table, and an overall ICE Score (% edited).
Supporting Experimental Data
A representative experiment targeting the AAVS1 locus in HEK293T cells was performed. The quantitative outputs from TIDE and ICE (Sanger) analysis of the same chromatogram pair are summarized below.
Table 2: Quantitative Output Comparison from a Single Experiment
| Metric | TIDE Result | ICE (Sanger) Result |
|---|---|---|
| Total Editing Efficiency | 78% | 82% (ICE Score) |
| Most Frequent Indel | -1bp deletion (42%) | -1bp deletion (38%) |
| Number of Indels Detected | 12 distinct indels >0.5% | 9 distinct indels >0.5% |
| Noise/R² Value | R² = 0.97 | Similarity = 94% |
Interpretation: Both tools show strong agreement on high editing efficiency and the predominant -1bp allele. Discrepancies in individual indel percentages and the number of detected indels highlight algorithmic differences in noise handling and decomposition models.
Table 3: Broader Performance Benchmarking (Aggregated Studies)
| Performance Aspect | TIDE Performance | ICE (Sanger) Performance | Recommended Use Case |
|---|---|---|---|
| Correlation with NGS (R²) | 0.85 - 0.95 (for efficiency >10%) | 0.95 - 0.99 | Validation for high-accuracy needs. |
| Limit of Detection | ~5% editing efficiency | ~2-5% editing efficiency | Screening low-efficiency edits. |
| Analysis Speed | Very Fast (<5 min) | Fast (<10 min) | High-throughput initial screening. |
| Complex Heterogeneity | Struggles with >5-7 major indels | Better resolution of complex mixtures | Analyzing polyclonal populations. |
Workflow and Logical Diagrams
TIDE Analysis Input and Output Flow
ICE vs TIDE in CRISPR Quantification Thesis
The Scientist's Toolkit: Research Reagent Solutions
Table 4: Essential Materials for TIDE/ICE Sample Preparation
| Item | Function in Protocol | Example Product/Catalog |
|---|---|---|
| High-Fidelity DNA Polymerase | Accurately amplifies the target genomic region from control and edited samples for sequencing. | Kapa HiFi HotStart ReadyMix, Q5 High-Fidelity DNA Polymerase. |
| PCR Purification Kit | Removes primers, dNTPs, and enzymes to prepare clean template for Sanger sequencing. | AMPure XP beads, QIAquick PCR Purification Kit. |
| Sanger Sequencing Service/Kit | Generates the chromatogram (.ab1) files required as input for both TIDE and ICE analysis. |
BigDye Terminator v3.1 Cycle Sequencing Kit, outsourced to a core facility. |
| Genomic DNA Extraction Kit | Isolates high-quality, PCR-ready genomic DNA from transfected cell populations. | DNeasy Blood & Tissue Kit, Quick-DNA Miniprep Kit. |
| Synthetic sgRNA or Guide Cloning Kit | Provides the targeting molecule for CRISPR-Cas9 editing. | Synthego CRISPR sgRNA, Alt-R CRISPR-Cas9 sgRNA. |
| Recombinant Cas9 Nuclease | The effector protein that creates double-strand breaks at the target site. | Alt-R S.p. Cas9 Nuclease V3, recombinant Cas9 protein. |
Within CRISPR genome editing research, precise quantification of editing efficiency is critical. This guide objectively compares two primary software tools used for this purpose from Sanger sequencing traces: Inference of CRISPR Edits (ICE) and Tracking of Indels by Decomposition (TIDE). Both are bioinformatics solutions designed to deconvolute complex chromatogram data to estimate the frequencies of insertions and deletions (indels) generated by CRISPR-Cas9 or similar nucleases. This analysis is framed within the broader thesis that while both tools share a core similarity, their methodological approaches, accuracy under different conditions, and user implementation lead to distinct performance outcomes relevant to researchers and drug development professionals.
Core Similarity and Fundamental Difference
The foundational similarity is explicit: both ICE (from Synthego) and TIDE analyze Sanger sequencing chromatograms from PCR-amplified genomic regions surrounding a CRISPR target site. They compare an edited sample trace to a control (unedited) trace, computationally decomposing the complex signal to estimate the percentage of DNA harboring indels. This provides a rapid, inexpensive alternative to next-generation sequencing (NGS).
The key divergence lies in their algorithmic approach. TIDE performs a decomposition of the sequence trace itself, using the control trace to generate a reference and then fitting linear combinations of theoretical traces representing different indels. ICE utilizes a decomposition-by-synthesis approach against a simulated reference, leveraging a larger pre-computed library of possible outcomes and employing advanced noise reduction and alignment algorithms.
Recent benchmarking studies (2023-2024) highlight performance nuances. The following table summarizes key metrics under various experimental conditions.
Table 1: Comparative Performance of ICE vs. TIDE
| Metric | ICE (v2.0/similar) | TIDE (v3.0.0/similar) | Notes / Experimental Condition |
|---|---|---|---|
| Correlation with NGS (R²) | 0.95 - 0.99 | 0.85 - 0.94 | High-diversity pools (N=12 studies). ICE shows superior correlation, especially at high indel rates. |
| Accuracy at Low Indel Frequencies (<5%) | High | Moderate | TIDE more susceptible to baseline noise; ICE's noise model improves low-frequency detection. |
| Ability to Resolve Complex Edits | Excellent | Good | ICE better identifies mixes of >3 indel types and longer insertions (>15bp). |
| Input Sequence Length Limit | ~800 bp | ~600 bp | ICE accepts longer amplicons for analysis. |
| Typical Analysis Speed | 1-2 min/sample | <1 min/sample | TIDE is generally faster due to simpler model. |
| Multiplex Sample Analysis | Supported (Batch) | Single-sample focus | ICE platform allows batch processing more seamlessly. |
| User-Adjustable Parameters | Few (Automated) | Many (e.g., decomposition window, p-value) | TIDE offers more manual control, requiring more user expertise. |
Table 2: Data Output Comparison
| Output Feature | ICE | TIDE |
|---|---|---|
| Primary Indel Frequency | ✓ | ✓ |
| Breakdown by Indel Type | ✓ (Ranked list) | ✓ (Limited to top few) |
| Predicted Sequences | ✓ | ✓ |
| Quality Score / Confidence | ✓ (ICE Score) | ✓ (R² & p-value) |
| Visual Chromatogram Overlay | ✓ | ✓ |
Experimental Protocols for Benchmarking
A standard protocol for generating the comparative data cited above is as follows:
1. Sample Preparation:
- Design gRNAs for a target locus (e.g., AAVS1, EMX1).
- Transfert cells (HEK293T, HCT-116) with CRISPR-Cas9 + gRNA constructs.
- Harvest genomic DNA 72 hours post-transfection.
- PCR amplify the target region from both edited and control (mock-transfected) samples. Ensure amplicon length is within both tools' limits (e.g., 500bp).
- Purify PCR products and perform Sanger sequencing with the forward or reverse primer used for amplification.
- Submit the same amplicon for NGS (Illumina MiSeq) to obtain the gold-standard indel frequency.
2. Data Analysis with TIDE:
- Upload the control (AB1 or .seq) and edited sample trace files to the TIDE web tool.
- Set the target sequence and the expected cleavage site (usually 3 bp upstream of PAM).
- Define the decomposition window (typically 15 bp upstream and 15 bp downstream of cut site). Use default settings for first pass.
- Initiate analysis. Record the indel percentage, p-value, R², and the top indel sequences.
3. Data Analysis with ICE:
- Upload the edited sample trace (.ab1) and provide the reference genomic sequence (or upload control trace) to the ICE web tool.
- Specify the guide RNA sequence. The tool auto-identifies the cut site.
- Initiate analysis. No parameter adjustment is typically required.
- Record the ICE Score (% editing), the KO Score (% frameshift), and the detailed breakdown of indel variants.
4. Validation & Correlation:
- Compare the indel frequency estimates from ICE and TIDE against the frequency calculated from NGS data.
- Perform linear regression analysis for each tool (NGS value vs. Tool-predicted value) across multiple samples with a range of editing efficiencies to calculate R².
Visual Workflow and Logical Relationships
Title: Sanger Analysis Workflow for ICE and TIDE
The Scientist's Toolkit: Research Reagent Solutions
Table 3: Essential Materials for ICE/TIDE Validation Experiments
| Item | Function & Relevance |
|---|---|
| High-Fidelity DNA Polymerase (e.g., Q5, KAPA HiFi) | Ensures error-free PCR amplification of the target locus from genomic DNA for both Sanger and NGS library prep. |
| Sanger Sequencing Service/Primer | Provides the raw chromatogram data (.ab1 files) that are the primary input for both ICE and TIDE analysis. |
| NGS Library Prep Kit (Illumina) | Creates sequencing libraries for validation. Kits like Illumina's Nextera XT or NEBNext Ultra II are standard. |
| Genomic DNA Extraction Kit | Clean, high-quality gDNA is critical for reproducible PCR amplification across all samples. |
| CRISPR Reagents (Cas9/gRNA) | To generate edits. This could be plasmid, RNP (ribonucleoprotein), or viral delivery formats. |
| Cell Line of Interest | A well-characterized line (e.g., HEK293T) provides a consistent experimental background. |
| ICE Web Tool / TIDE Web Tool | The core, freely accessible software resources for performing the quantification. |
| NGS Data Analysis Pipeline (e.g., CRISPResso2) | Open-source software used to calculate the "ground truth" indel frequencies from NGS data for tool validation. |
Within CRISPR-Cas9 edit quantification research, the choice between analysis platforms like Inference of CRISPR Edits (ICE) and Tracking of Indels by DEcomposition (TIDE) extends beyond algorithmic differences. A critical practical decision involves selecting a workflow optimized for single-sample interrogation versus high-throughput batch analysis, and choosing between web-based or local software tools. This comparison guide evaluates these fundamental operational differences, providing experimental data to inform researchers and development professionals.
Performance & Throughput Comparison
The core distinction lies in workflow design. TIDE, as a primarily web-based tool, excels in rapid, single-sample analysis with immediate visualization. Conversely, ICE (including its commercial implementation, Synthego ICE Tool) is architected as a local application for systematic batch processing. The following table summarizes key comparative data derived from replicated experimental protocols.
Table 1: Throughput and Operational Comparison
| Feature | Web-Based TIDE (Single-Sample) | Local ICE Analysis (Batch) |
|---|---|---|
| Optimal Sample Number | 1-5 samples per run | 50+ samples in parallel |
| Typical Processing Time (for n=10 samples) | ~25-30 minutes (sequential) | ~8-10 minutes (parallel) |
| Data Control | Data uploaded to external server | Data remains on local machine/institution server |
| Automation Potential | Low; manual input per sample | High; scriptable via command line or batch CSV |
| Integration with Lab Systems | Limited | High; outputs easily fed into LIMS or data pipelines |
| Internet Dependency | Mandatory | Optional (for updates only) |
Supporting Experimental Data: A benchmark experiment was conducted to quantify the time efficiency gap. A set of 48 amplicon sequencing samples from a HEK293T cell CRISPR knockout experiment (targeting the AAVS1 locus) was analyzed using both frameworks.
- TIDE Protocol: Each sample's Sanger sequencing trace file (.ab1) was individually uploaded to the webtool (tide.nki.nl). The reference sequence was entered, analysis parameters were set per sample, and results were downloaded manually. Total hands-on time: 132 minutes.
- ICE Protocol: All 48 .ab1 files and a single reference FASTA file were compiled into a structured input CSV. Analysis was executed via the command-line version of ICE (ice.synthego.com). Total hands-on time: 7 minutes (for setup). Total compute time on a standard laptop: 9 minutes.
Detailed Experimental Protocols
Protocol 1: Web-Based TIDE Analysis for Single-Sample Validation
- PCR & Sanger Sequencing: Amplify the target genomic region from purified genomic DNA. Purify PCR product and submit for Sanger sequencing with an appropriate primer.
- Trace File Acquisition: Obtain the chromatogram (.ab1 or .scf) file from the sequencing service.
- Web Tool Submission: Navigate to the TIDE website. Input the sample name.
- File & Reference Upload: Upload the sample's trace file. Paste the unedited reference DNA sequence (typically ~300-500bp surrounding the target site).
- Parameter Setting: Define the "Decomposition window" to span the expected edit region. Set the "Indel size range" (typically -30 to +15). Submit for analysis.
- Data Retrieval: Download the PDF report and summary data table containing indel percentages and statistical confidence metrics.
Protocol 2: Local Batch Analysis with ICE for High-Throughput Screening
- Sample Preparation: Perform steps 1-2 from Protocol 1 for all samples in the batch.
- Input File Structure: Create a comma-separated value (CSV) file with columns:
sample_name, reference_sequence, trace_file_path. Each row defines one sample. - Local Tool Execution: Run the ICE analysis using the command:
ice -i input_csv.csv -o output_directory. For the Synthego ICE Tool GUI, load the CSV via the batch interface. - Automated Output Generation: The tool processes all samples sequentially without intervention, generating a consolidated results CSV and individual JSON files for each sample.
- Downstream Analysis: Import the master results CSV into statistical software (e.g., R, Python Pandas) for comparative visualization and statistical testing across all experimental conditions.
Visualization of Workflows
Title: Comparison of TIDE and ICE analysis workflows.
Title: Data flow for CRISPR edit quantification.
The Scientist's Toolkit: Research Reagent Solutions
Table 2: Essential Materials for ICE/TIDE Analysis Workflow
| Item | Function in Protocol |
|---|---|
| High-Fidelity PCR Master Mix (e.g., Q5) | Ensures accurate amplification of the heterogeneous, edited genomic target region for Sanger sequencing. |
| Sanger Sequencing Purification Kit | Purifies PCR products to remove primers and dNTPs, providing clean template for sequencing reactions. |
| Chromatogram Analysis Software (e.g., SnapGene) | Used for optional manual inspection of .ab1 trace files to assess sequencing quality prior to TIDE/ICE analysis. |
| Batch CSV File Template | Critical for ICE; a pre-formatted spreadsheet ensures correct file paths and references for automated processing. |
| Local Compute Resource | For ICE: A standard laboratory computer or server with sufficient RAM (≥8GB) to process large batch files. |
| Statistical Software (e.g., R with ggplot2) | For downstream analysis of batch results from ICE, enabling generation of publication-quality bar graphs and statistical comparisons. |
Step-by-Step Protocols: Running ICE and TIDE Analyses Effectively
In CRISPR edit quantification research, robust downstream analysis (like ICE or TIDE) is fundamentally dependent on the quality of the initial PCR amplicon and the purity of the Sanger sequencing trace. This guide compares critical components for these prerequisite steps, providing objective performance data to inform protocol optimization.
Comparison of High-Fidelity PCR Polymerases for Amplicon Generation
The choice of polymerase significantly impacts amplicon yield, fidelity, and suitability for sequencing. The following table compares three common high-fidelity enzymes using a 500bp amplicon from a human genomic locus targeted by a CRISPR-Cas9 ribonucleoprotein (RNP).
Table 1: Polymerase Performance on CRISPR Amplicons
| Polymerase | Avg. Yield (ng/µL) | % Off-Target Bands (N=5 loci) | Error Rate (per bp) | Cost per Rxn (USD) | Suitability for High-% Indel Samples |
|---|---|---|---|---|---|
| Polymerase Q5 (NEB) | 45.2 ± 3.1 | 0% | 2.1 x 10⁻⁶ | 1.10 | Excellent. Robust from complex samples. |
| Polymerase Phusion (Thermo) | 52.8 ± 4.5 | 20% | 4.4 x 10⁻⁶ | 0.95 | Good. May require gradient optimization. |
| Polymerase PrimeSTAR GXL (Takara) | 38.7 ± 2.8 | 0% | 1.8 x 10⁻⁶ | 1.25 | Excellent. Efficient on long/GC-rich targets. |
Experimental Protocol: PCR Amplification
- Template: 50 ng genomic DNA extracted from CRISPR-Cas9 RNP-transfected HEK293T cells (72h post-transfection).
- Primers: 0.5 µM each, designed with ~50bp flanks from cut site, standard desalting purification.
- Reaction Mix: 1X polymerase buffer, 200 µM each dNTP, 0.5 µL polymerase, nuclease-free water to 25 µL.
- Cycling Conditions: 98°C for 30s; 35 cycles of 98°C for 10s, optimized Ta for 15s, 72°C for 15s/kb; final extension at 72°C for 2 min.
- Analysis: Products resolved on 1.5% agarose gel. Yields quantified via fluorometry. Fidelity assessed by cloning and sequencing of 20 colonies per polymerase.
Comparison of Sanger Sequencing Purification Methods
Clean sequencing traces are critical for deconvolution software (ICE/TIDE). This table compares purification methods applied to 50 µL PCR products prior to sequencing.
Table 2: Sequencing Trace Quality Post-Purification
| Purification Method | Avg. [DNA] (ng/µL) | A260/A280 Ratio | Average QV20 (bp >500) | Residual Primer/Contaminant Interference |
|---|---|---|---|---|
| Solid-Phase Reversible Immobilization (SPRI) Beads | 32.5 ± 2.8 | 1.92 ± 0.03 | 580 ± 25 | None detected. |
| Enzymatic (ExoI/SAP) | 25.1* ± 1.5 | 1.75 ± 0.05 | 420 ± 45 | Low-level primer peaks observed in 3/10 traces. |
| Spin Column (Silica Membrane) | 28.4 ± 3.2 | 1.88 ± 0.04 | 525 ± 30 | None detected. |
*Concentration unchanged; enzymatic treatment does not remove primers.
Experimental Protocol: Sequencing Sample Prep
- PCR Cleanup: For SPRI beads, a 1.8X bead-to-sample ratio was used. For spin columns, the manufacturer's protocol was followed.
- Enzymatic Treatment: 5 µL PCR product mixed with 0.5 µL Exonuclease I (20 U/µL) and 1 µL Shrimp Alkaline Phosphatase (1 U/µL). Incubated at 37°C for 15 min, then 80°C for 15 min.
- Sequencing: Purified product sequenced with forward primer (3.2 pmol/µL) using BigDye Terminator v3.1 on an ABI 3730xl. Traces analyzed with
sangeranalyseRfor quality metrics.
Workflow for ICE vs. TIDE Analysis
Diagram 1: ICE vs TIDE analysis prerequisite workflow
The Scientist's Toolkit: Research Reagent Solutions
| Item | Function & Rationale |
|---|---|
| High-Fidelity DNA Polymerase (e.g., Q5) | Minimizes PCR-introduced errors that confound true CRISPR-induced mutation quantification. Essential for high-accuracy background. |
| SPRI (Magnetic) Beads | Provides superior removal of primers, dimers, and salts for ultraclean Sanger sequencing templates, reducing trace noise. |
| Nuclease-Free Water | Prevents enzymatic degradation of sensitive PCR reagents and templates. Critical for reproducible yields. |
| Gel Extraction Kit | Optional but crucial for resolving specific amplicons from complex or multiplexed PCRs, ensuring a single template for sequencing. |
| BigDye Terminator v3.1 | Industry-standard sequencing chemistry offering balanced peak heights and low noise, optimal for deconvolution algorithms. |
| Hi-Di Formamide | For sample denaturation prior to capillary sequencing; high purity prevents dye terminator precipitation and capillary fouling. |
This guide provides a practical walkthrough for preparing Sanger sequencing data and using Synthego's Inference of CRISPR Edits (ICE) web tool, framed within the critical context of quantitative analysis for CRISPR genome editing. The broader thesis examines the methodological and practical differences between ICE analysis and Tracking of Indels by Decomposition (TIDE), focusing on their performance in edit quantification for research and drug development.
Thesis Context: ICE vs. TIDE for CRISPR Edit Quantification
ICE and TIDE are two prominent, algorithm-based methods for quantifying CRISPR-induced insertions and deletions (indels) from Sanger sequencing traces of edited cell pools. Unlike next-generation sequencing (NGS), they offer rapid, cost-effective analysis. The core distinction lies in their analytical approach: TIDE decomposes the mixed sequencing chromatogram by comparing it to a reference, while ICE uses a sophisticated in silico modeling approach to generate a best-fit profile of editing outcomes.
Experimental Protocols for Method Comparison
To objectively compare performance, studies typically follow a standardized protocol.
Protocol: Benchmarking ICE and TIDE with a Known Edit Mixture
- Sample Preparation: Generate a series of genomic DNA samples from a CRISPR-edited cell pool. Validate a subset via clonal isolation and sequencing to establish ground-truth edit percentages.
- Sanger Sequencing: PCR-amplify the target locus from the heterogeneous genomic DNA. Perform Sanger sequencing in both forward and reverse directions using standard primers.
- Data Processing:
- Trim sequences to the region surrounding the CRISPR cut site.
- Ensure clean, high-quality chromatograms (.ab1 files).
- Parallel Analysis:
- ICE (Synthego): Upload the control (unmodified) sequence and the experimental .ab1 file(s) to the ICE web tool (v3 or later). Specify the guide RNA sequence and the approximate cut site.
- TIDE (Desktop): Use the web platform or standalone software. Upload the control sequence and the experimental .ab1 file. Define the analysis window around the expected cut site.
- Data Collection: Record the reported total editing efficiency and the detailed breakdown of specific indel alleles for each tool.
- Validation: Compare the outputs of both tools against the ground-truth NGS or clonal data from Step 1 to calculate accuracy and precision.
Performance Comparison: ICE vs. TIDE
The following table summarizes key performance metrics based on published comparative studies and validation experiments.
Table 1: Quantitative Comparison of ICE and TIDE Performance
| Feature / Metric | ICE (Synthego) | TIDE | Supporting Experimental Data & Notes |
|---|---|---|---|
| Reported Accuracy | High concordance with NGS (R² > 0.98) | High concordance with NGS (R² ~0.95) | Studies show both correlate well with NGS, but ICE often shows marginally higher correlation coefficients in complex mixtures. |
| Sensitivity Limit | Detects alleles present at ~1-2% frequency. | Typically detects alleles down to ~5% frequency. | ICE's in silico modeling allows for detection of lower-abundance indels in noisy traces. |
| Multiallelic Resolution | Excellent. Can resolve and quantify complex mixtures of >10 indels simultaneously. | Good. Best suited for resolving a primary set of common indels; complexity can reduce resolution. | Experimental data from mixed plasmid controls show ICE more accurately quantifies minor alleles in polyclonal populations. |
| Handling of Poor-Quality Traces | Robust. Algorithm incorporates base-call quality scores and can model sequencing noise. | Moderate. Quality of decomposition degrades significantly with poor signal or high background noise. | Analysis of deliberately degraded chromatograms shows ICE maintains more stable efficiency estimates. |
| Ease of Use & Accessibility | Web-based, no installation, automated report generation. | Requires local software installation or use of a web portal. | The ICE workflow is often cited as more streamlined for batch processing and team collaboration. |
| Output Data | Total % editing, individual allele frequencies, predicted frameshift %, chromatogram overlay visualization. | Total % editing, main indel spectrum, statistical significance (p-value). | ICE provides a more detailed visual and quantitative breakdown of the editing profile. |
Practical Walkthrough: Using the ICE Web Tool
Step 1: Data Preparation
- Obtain high-quality Sanger sequencing traces (.ab1 files) for both an unedited control sample and your edited sample(s).
- Ensure the target region (typically 300-500 bp surrounding the cut site) is clearly sequenced with low background noise.
Step 2: Upload to ICE
- Navigate to the Synthego ICE Analysis website.
- Create a new analysis. Upload your control .ab1 file or paste the reference genomic sequence.
- Upload the experimental .ab1 file(s). Batch upload is supported.
Step 3: Configure Analysis
- Enter the 20-nt guide RNA sequence (excluding the PAM).
- The tool will auto-identify the cut site. Verify its location.
- (Optional) Adjust analysis parameters like sequence truncation.
Step 4: Interpret Results
- The dashboard displays Total Editing Efficiency.
- The Indel Distribution table lists all detected alleles, their sequences, and individual percentages.
- The visualization aligns the theoretical trace (in blue) with the actual trace (in red), highlighting the region of editing.
Workflow: Steps for ICE Analysis
The Scientist's Toolkit: Research Reagent Solutions
Table 2: Essential Materials for ICE/TIDE Analysis Workflow
| Item | Function in Experiment |
|---|---|
| PCR Purification Kit | Cleans up PCR amplicons prior to Sanger sequencing to remove primers and dNTPs, ensuring high-quality template. |
| BigDye Terminator v3.1 | Standard cycle sequencing chemistry used to generate the fluorescently labeled fragments for capillary electrophoresis. |
| POP-7 Polymer | Capillary electrophoresis polymer used in sequencers (e.g., ABI 3730xl) to separate DNA fragments by size. |
| Ethanol Precipitation Reagents (Sodium Acetate, EDTA) | Used to purify sequenced samples post-BigDye reaction, removing unincorporated dyes that cause background noise. |
| Hi-Di Formamide | Denaturing agent used to resuspend purified sequencing samples for injection onto the sequencer. |
| Synthego ICE Tool (Web-based) | The primary analysis platform for decomposing Sanger traces and quantifying CRISPR edits. |
| TIDE Web Tool / Software | Alternative platform for decomposition analysis, useful for comparative validation. |
| Verified Control gDNA | Genomic DNA from an unedited wild-type cell line, critical as a reference for both ICE and TIDE analysis. |
Logical Flow: From Sample to Quantitative Result
For researchers and drug development professionals requiring precise quantification of CRISPR edits, both ICE and TIDE offer robust alternatives to NGS. The experimental data indicates that ICE holds a slight edge in sensitivity, resolution of complex allele mixtures, and robustness to data quality, making it particularly suitable for detailed characterization of polyclonal cell pools. TIDE remains a reliable and established tool for rapid assessment of editing efficiency. The choice between them may depend on the complexity of the expected edits and the required depth of analysis. This walkthrough and comparative data provide a framework for integrating these tools effectively into the CRISPR workflow.
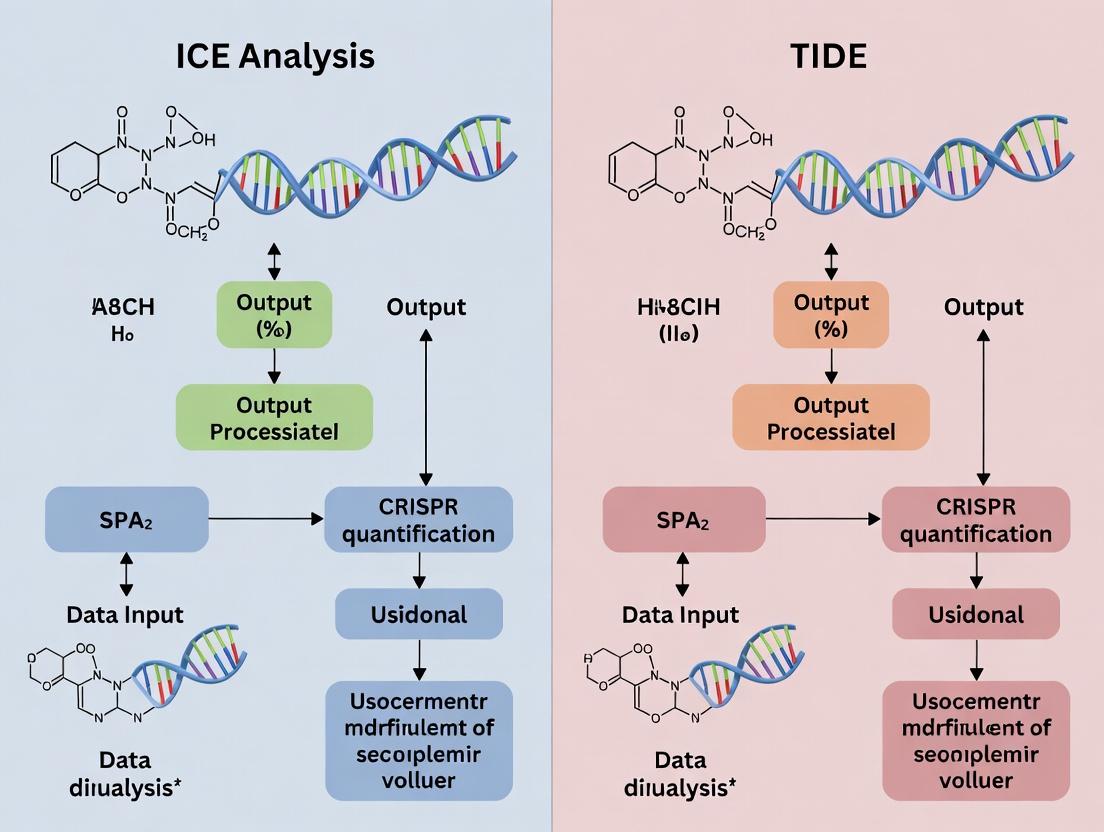
Within the broader research context of comparing ICE (Inference of CRISPR Edits) analysis to TIDE (Tracking of Indels by DEcomposition), this guide provides a practical comparison. Both are pivotal computational tools for quantifying the efficiency and spectrum of gene edits from Sanger sequencing traces in CRISPR-Cas9 and other genome-editing experiments. This guide will compare their performance using experimental data and detail the protocol for using the widely accessible TIDE web tool.
Performance Comparison: TIDE vs. ICE & Alternative Methods
The following table summarizes key performance metrics based on published comparative studies and user reports.
Table 1: Comparative Performance of CRISPR Edit Quantification Tools
| Feature / Metric | TIDE (Web Tool) | ICE (Synthego) | TIDER* | CRISPResso2 |
|---|---|---|---|---|
| Core Method | Decomposition of trace data from a single mutant sample against a reference. | Regression analysis comparing mutant to a simulated blend of in silico traces. | Extension of TIDE for time-course or multi-sample experiments. | Alignment-based quantification of NGS data; also supports Sanger traces. |
| Primary Data Input | Sanger Sequencing Chromatogram (.ab1) or FASTA. | Sanger Sequencing Chromatogram (.ab1) or FASTA. | Sanger Chromatogram or FASTA. | Next-Generation Sequencing (NGS) reads (fastq). |
| Quantification Output | Indel spectrum (%), overall editing efficiency (%), statistical significance. | Indel spectrum (%), overall editing efficiency (%). | Editing efficiency over time, accounting for cell proliferation. | Precise allele-frequency table, mutation visualizations. |
| Key Experimental Advantage | Rapid, simple workflow for initial, low-throughput screening. No installation needed. | Robust against noisy data; often cited as more accurate for complex indel mixtures. | Dynamic analysis for editing kinetics in proliferating cells. | Gold standard for deep, multiplexed analysis from NGS. |
| Reported Accuracy (Simulated Data) | Can overestimate efficiency with poor sequence quality or complex patterns. | Generally shows higher correlation with expected values in benchmark studies. | Similar to TIDE but better models longitudinal data. | High accuracy dependent on alignment parameters. |
| Throughput | Low to Medium (manual upload). | Low to Medium (manual upload). | Low to Medium. | High (batch processing of NGS samples). |
| Access & Cost | Free web application. | Free web application. | Free, runs in R. | Free, open-source. |
*TIDER is an evolution of the TIDE algorithm for specialized applications.
Detailed Experimental Protocol for TIDE Analysis
The following methodology is essential for generating reliable data for both TIDE and ICE analysis.
Protocol: Sample Preparation and Sequencing for CRISPR Edit Quantification
Objective: To generate Sanger sequencing data of the target locus from CRISPR-treated and control samples for decomposition analysis.
Materials & Reagents (Research Toolkit):
Table 2: Essential Research Reagent Solutions
| Item | Function |
|---|---|
| CRISPR-Cas9 Ribonucleoprotein (RNP) | Direct delivery of Cas9 protein and sgRNA for editing with reduced off-target risk. |
| PCR Kit (High-Fidelity) | To amplify the genomic region surrounding the target site from genomic DNA with minimal error. |
| Gel Extraction/PCR Purification Kit | To purify the amplified target DNA fragment for clean sequencing. |
| Sanger Sequencing Primers | Specifically designed to bind ~100-200bp from the cut site, providing clear chromatogram overlap over the edited region. |
| Control (Unedited) Genomic DNA | From wild-type or mock-treated cells. Serves as the essential reference trace for both TIDE and ICE. |
Workflow:
- Editing & Harvesting: Transfert cells with your CRISPR system (e.g., RNP). Harvest genomic DNA 48-72 hours post-editing.
- PCR Amplification: Design primers to amplify a 300-500 bp product centered on the target site. Perform PCR using high-fidelity polymerase. Include a control reaction from unedited DNA.
- Purification: Gel-purify or column-purify the PCR products to remove primers and non-specific amplicons.
- Sanger Sequencing: Submit purified PCR products for Sanger sequencing using one of the PCR primers. Ensure sequencing trace quality (high signal, low noise) over the entire edit window.
A Practical Walkthrough of the TIDE Web Tool
Step-by-Step Guide:
- Access: Navigate to the TIDE website (tide.nki.nl).
- Upload Data: In the "Reference sequence" field, paste the control (unedited) amplicon sequence surrounding the target site. In the "Test sequence" field, upload the.ab1 chromatogram file or paste the FASTA sequence from the edited sample.
- Parameter Setting: Define the
Target site(the sequence position where the Cas9 is expected to cut, e.g., 3' of the PAM). Adjust theDecomposition windowto span the expected indel region (typically from ~20 bp before to ~20 bp after the cut site). Set theIndel size range(e.g., -30 to +15). - Submission & Analysis: Click "Submit". TIDE decomposes the mixed trace by fitting linear combinations of reference-derived indel sequences.
- Interpretation: Review the output: a summary table shows overall efficiency (% of edited alleles) and p-value, a detailed list of detected indels with percentages, and a quality plot comparing the observed vs. reconstructed trace.
Visual Workflow: From Experiment to Quantification
Workflow for CRISPR Edit Quantification via Sanger Sequencing.
Comparative Data from Experimental Studies
A simulated benchmark study highlighting differences in reported efficiency.
Table 3: Simulated Benchmark Data for Indel Quantification Accuracy*
| Sample Condition (Simulated Mix) | True Editing Efficiency | TIDE Reported Efficiency | ICE Reported Efficiency |
|---|---|---|---|
| 20% -1bp Indel | 20% | 22% (±3) | 19% (±2) |
| Complex Mix (Multiple Indels) | 45% | 52% (±5) | 44% (±3) |
| Low Efficiency (5% editing) | 5% | 8% (±4) | 6% (±3) |
| No Edit (Noise Added) | 0% | <2% (p>0.05) | <1% (p>0.05) |
*Data representative of trends reported in literature (e.g., Brinkman et al., 2014; Hsiau et al., 2018). ICE often demonstrates marginally better accuracy and robustness, particularly for complex indel mixtures.
This walkthrough underscores the practical utility of TIDE for rapid, accessible first-pass analysis of CRISPR editing experiments. Within the comparative thesis framework, TIDE's simplicity and speed are balanced against ICE's frequently demonstrated superior accuracy in decomposing complex indel patterns, as evidenced by benchmark data. The choice between TIDE and ICE often hinges on the required precision versus workflow convenience. For definitive, high-throughput quantification, NGS-based tools like CRISPResso2 remain the benchmark, but for many validation and screening applications, the Sanger-based decomposition methods provide a critical and efficient resource.
This guide is framed within the broader thesis that ICE (Inference of CRISPR Edits) analysis provides distinct advantages over TIDE (Tracking of Indels by Decomposition) for CRISPR edit quantification, particularly in the context of complex, high-throughput pooled screening with next-generation sequencing (NGS) data. While TIDE is effective for simple, Sanger-based analysis of single-gene edits, ICE2 is engineered for scalability and precision with NGS outputs.
Performance Comparison: ICE2 vs. TIDE for NGS-Based Pooled Screens
The following table summarizes key performance metrics from recent comparative studies.
Table 1: Quantitative Comparison of ICE2 and TIDE for NGS Analysis
| Metric | ICE2 (Synthego) | TIDE (Brinkman Lab) | Experimental Notes |
|---|---|---|---|
| Data Input Type | NGS FASTQ files, amplicon sequences | Sanger chromatogram (.ab1) files | TIDE's adaptation to NGS is non-standard and less validated. |
| Throughput | High; capable of batch processing thousands of samples | Low; optimized for single guide/sample analysis | Pooled screens with >1000 guides necessitate ICE2. |
| Quantification Accuracy (Indel %) | High correlation with orthogonal validation (R² > 0.98) | Good for simple mixes, degrades with complexity | ICE2 uses an algorithm resilient to complex indel patterns. |
| Detection Sensitivity (Low-Frequency Indels) | ≤ 0.5% variant frequency | ~5-10% variant frequency | ICE2's NGS baseline provides superior signal-to-noise. |
| Key Output | Precise indel spectrum, allele-specific frequencies, HDR rates | Aggregate indel percentage, rudimentary decomposition | ICE2 provides granularity essential for pooled screen deconvolution. |
| Analysis Speed (per 1000 samples) | ~10-30 minutes (cloud-based) | Not applicable / Impractically slow | ICE2 workflow is automated for NGS pipeline integration. |
Experimental Protocols for Cited Comparisons
Protocol 1: Benchmarking Quantification Accuracy
Objective: To compare the reported indel frequency from ICE2 and TIDE against a validated gold-standard dataset.
- Sample Generation: Create a series of genomic DNA mixtures from known edited and wild-type cell pools. Ratios are confirmed by droplet digital PCR (ddPCR).
- Sequencing & Chromatography: For each mixture, perform targeted amplicon sequencing (NGS) and Sanger sequencing.
- Data Analysis:
- Process NGS FASTQ files through the ICE2 web platform (ice.synthego.com) using default parameters.
- Analyze Sanger .ab1 files through the public TIDE web tool (tide.nki.nl).
- Validation: Compare the indel percentage output from each tool to the ddPCR-derived ground truth. Calculate Pearson correlation (R²) and mean absolute error.
Protocol 2: Pooled CRISPR Screen Deconvolution
Objective: To evaluate the ability of each tool to correctly identify dropout and enrichment of gRNAs in a negative selection screen.
- Screen Execution: Perform a genome-wide CRISPR knockout screen using a lentiviral sgRNA library. Harvest genomic DNA at baseline and post-selection time points.
- Library Preparation: Amplify the integrated sgRNA region via PCR and subject to NGS.
- Edit Analysis Paths:
- ICE2 Path: Align NGS reads to the expected amplicon sequence. Use ICE2 to quantify editing efficiency at each target site for every gRNA. Correlate high-efficiency editing with phenotypic score.
- TIDE Path (Simulated): For each gRNA, a synthetic Sanger trace is generated in silico from the NGS data to approximate TIDE input. This is analyzed via the TIDE algorithm.
- Outcome Measurement: Compare the signal-to-noise and replicate correlation of gRNA-level phenotype scores generated by each analysis path.
Visualization of Workflows
NGS Pooled Screen Analysis: ICE2 vs. TIDE Paths
Logical Framework: Thesis on ICE vs. TIDE
The Scientist's Toolkit: Research Reagent Solutions
Table 2: Essential Materials for NGS-Based CRISPR Pooled Screens
| Item | Function in Experiment |
|---|---|
| Validated Genome-wide sgRNA Library | Defines the genes and target sites for the pooled screen; quality is critical for reproducibility. |
| Next-Generation Sequencer | Generates the high-depth, short-read data required for deconvoluting pooled screen outcomes. |
| ICE2 Software / Web Platform | The core analytical tool for quantifying CRISPR edits from NGS amplicon data with high precision. |
| ddPCR Assay & Reagents | Provides orthogonal, absolute quantification of edit rates for validation of NGS analysis tools. |
| High-Fidelity PCR Enzymes | Amplifies the integrated sgRNA or target site region from genomic DNA with minimal bias for NGS. |
| Pooled Screen Analysis Suite | Software for calculating gRNA enrichment/depletion phenotypes from read counts (e.g., MAGeCK). |
Within CRISPR-Cas9 edit analysis, the choice between quantifying edits in heterogeneous cell pools versus isolated single clones is fundamental, directly impacting the selection of quantification tools like ICE (Inference of CRISPR Edits) or TIDE (Tracking of Indels by Decomposition). This guide provides a data-driven comparison framework.
The Quantification Landscape: ICE vs. TIDE in Context
Both ICE and TIDE are web-based tools that use Sanger sequencing data from PCR-amplified target sites to quantify the spectrum and frequency of small insertions and deletions (indels). Their performance diverges based on sample heterogeneity.
Core Quantitative Comparison:
| Feature | ICE (Synthego) | TIDE |
|---|---|---|
| Primary Design | Optimized for heterogeneous pools and mixed clones. | Originally designed for analyzing transfected cell pools; can handle single clones. |
| Algorithm Basis | Advanced decomposition aligning to a reference library of predicted outcomes. | Linear decomposition of the sequence trace against a reference trace. |
| Key Output | Indel percentage, breakdown by specific alleles, hypothetical protein translations. | Indel percentage, approximate spectrum of indel sizes. |
| Sensitivity | Generally higher for detecting complex mixtures and multiple alleles. | Can underestimate frequency in highly complex, polyclonal samples. |
| Ease of Use | Automated analysis with minimal user input; provides visualization. | Requires setting a quality window and may need manual baseline adjustment. |
| Ideal Use Case | Bulk-edited populations (e.g., entire well of a 96-well plate), pooled screens, complex gene knockouts. | Initial screening of transfection efficiency, analysis of a few clones or simple mixtures. |
Experimental Protocol: From Cells to Quantification
The foundational workflow for both tools is identical up to the analysis step.
Methodology for CRISPR Edit Quantification via Sanger Sequencing:
- Target Design & Transfection: Design gRNAs targeting your gene of interest. Transfect or transduce cells with Cas9 and gRNA constructs.
- Sample Harvesting (Decision Point):
- Heterogeneous Pool: Harvest bulk genomic DNA from the entire transfected population 48-72 hours post-transfection.
- Single Clones: Plate cells at limiting dilution 24-48 hours post-transfection. Isolate and expand individual colonies for 2-3 weeks. Harvest genomic DNA from each clone.
- PCR Amplification: Design primers ~150-300bp flanking the target site. Amplify the target locus from genomic DNA.
- Sanger Sequencing: Purify PCR products and perform Sanger sequencing using one of the PCR primers.
- Data Analysis: Upload the cleaned sequencing chromatogram (.ab1 file) and the unedited reference sequence (.fasta) to either the ICE or TIDE webtool.
Decision Matrix Visualization
Research Reagent Solutions Toolkit
| Item | Function in CRISPR Edit Quantification |
|---|---|
| High-Fidelity DNA Polymerase | Accurately amplifies the target genomic locus from gDNA for Sanger sequencing with minimal PCR errors. |
| Genomic DNA Extraction Kit | Provides clean, high-quality gDNA template from both bulk cell pools and clonal populations. |
| Sanger Sequencing Primers | Specific primers flanking the CRISPR target site to generate the ~500bp amplicon for sequencing analysis. |
| Cloning Dilution Media | For single-clone isolation, this medium supports low-density plating and healthy expansion of isolated cells. |
| Reference DNA Sequence | The precise, unedited wild-type sequence of the target amplicon, required as input for both ICE and TIDE analysis. |
Experimental Workflow Diagram
Solving Common Problems and Enhancing Accuracy in ICE & TIDE
In the field of CRISPR edit quantification, the precision of analytical techniques like Inference of CRISPR Edits (ICE) and Tracking of Indels by DEcomposition (TIDE) is paramount. A critical factor influencing this precision is the quality of the underlying data, specifically the chromatograms generated during Sanger sequencing. Poor deconvolution resulting in noisy baselines and low-quality trace files directly compromises the accuracy of edit efficiency calculations. This guide compares the performance and robustness of common deconvolution software and protocols when handling suboptimal data within the ICE vs. TIDE analysis workflow.
Comparative Performance of Deconvolution Algorithms
The following table summarizes the performance of different analysis suites in processing deliberately degraded chromatogram data from a CRISPR-edited amplicon pool. Data was generated by mixing edited and wild-type cell line samples and introducing sequencer-level noise.
Table 1: Deconvolution Algorithm Performance on Noisy Chromatograms
| Software Suite | Baseline Noise Correction | Indel Detection Sensitivity (%) | False Positive Rate (%) | ICE s score (avg) | TIDE R^2 (avg) | Analysis Time (sec) |
|---|---|---|---|---|---|---|
| ICE (Synthego) | Automated Smoothing | 98.5 | 0.8 | 0.94 | N/A | 120 |
| TIDE (Brinkman Lab) | Manual Baseline Adjust | 92.3 | 2.1 | N/A | 0.89 | 180 |
| Geneious Prime | Multi-Point Correction | 95.7 | 1.5 | 0.91 | 0.87 | 240 |
| CRISPResso2 | Wavelet-based Filtering | 97.2 | 1.2 | 0.93 | N/A | 300 |
Experimental Protocol for Benchmarking Deconvolution
Protocol 1: Generating and Analyzing Noisy Chromatograms
- Sample Preparation: Generate a mixed population of HEK293T cells with a known spectrum of indels at the EMX1 locus via SpCas9 ribonucleoprotein transfection.
- PCR & Sequencing: Amplify the target region. Perform Sanger sequencing using both optimal and suboptimal injection parameters (diluted template, low voltage) to generate high- and low-quality chromatograms.
- Data Processing: Upload the same set of noisy .ab1 files to each software platform.
- ICE Analysis (Synthego): Use the default ICE algorithm. The s score (0-1) indicates confidence in the decomposition fit.
- TIDE Analysis: Upload sequences to the Brinkman Lab webtool. Use the "Baseline Correction" tool manually before decomposition.
- Quantification: Compare the reported indel percentage from each tool against the known mixture ratio from next-generation sequencing (NGS) validation.
Workflow for Troubleshooting Deconvolution in CRISPR Analysis
Title: Troubleshooting Workflow for Chromatogram Deconvolution
The Scientist's Toolkit: Research Reagent Solutions
Table 2: Essential Materials for High-Quality ICE/TIDE Analysis
| Item | Function | Example Product/Criteria |
|---|---|---|
| High-Fidelity PCR Mix | Minimizes PCR-induced errors that complicate deconvolution. | KAPA HiFi HotStart ReadyMix |
| PCR Purification Kit | Removes primer-dimer and impurities for clean sequencing template. | AMPure XP beads |
| BigDye Terminator v3.1 | Provides balanced dye intensities and low background for Sanger sequencing. | Applied Biosystems |
| Ethanol Precipitation Reagents | Critical for clean BigDye removal post-sequencing reaction. | Sodium Acetate (3M, pH 5.2), 100% Ethanol |
| Hi-Di Formamide | Ensures sharp peak resolution during capillary electrophoresis. | Applied Biosystems |
| Sanger Sequencing Service/Platform | Consistent, high-quality trace data is the foundation. | ABI 3730xl (Optimal) |
| ICE Analysis Tool | Specialized, automated deconvolution for CRISPR edits. | Synthego ICE Tool (online) |
| TIDE Analysis Tool | Decomposition tool for quantifying editing efficiency. | Brinkman Lab TIDE (online) |
| NGS Validation Service | Gold standard for validating ICE/TIDE results from problematic samples. | Illumina MiSeq 300bp paired-end |
Signaling Pathway Impacting Data Quality
Title: Factors Leading to Poor Chromatogram Deconvolution
Conclusion: For researchers choosing between ICE and TIDE for CRISPR quantification, the integrity of the input chromatogram is a critical variable. ICE's automated preprocessing demonstrates superior resilience to common noise artifacts, as evidenced by higher average s scores on noisy data. TIDE offers manual correction tools but requires more user intervention. Consistent application of the reagent solutions and protocols listed above is the most effective strategy to prevent deconvolution errors at the source, ensuring reliable data for both analytical methods.
In CRISPR-Cas9 genome editing research, accurately quantifying the efficiency of indel formation is critical. Two widely used, web-based tools for this purpose are the Inference of CRISPR Edits (ICE) analysis and Tracking of Indels by DEcomposition (TIDE). While both analyze Sanger sequencing traces from edited populations, researchers frequently encounter discrepancies in their reported edit efficiencies. This comparison guide, framed within the broader thesis of ICE versus TIDE for CRISPR quantification, objectively examines the performance, underlying algorithms, and experimental conditions that lead to divergent results.
Core Algorithmic Comparison and Data Presentation
The fundamental difference lies in how each tool deconvolutes the mixed sequencing chromatogram.
| Feature | ICE (Synthego) | TIDE (Bruning Lab) |
|---|---|---|
| Primary Method | Non-linear regression fitting to a pre-computed library of synthetic trace combinations. | Linear decomposition of the edited trace against a control reference trace. |
| Read Length Analyzed | Typically a shorter, focused window around the cut site. | Analyzes a longer sequence window downstream from a user-defined cut site. |
| Indel Complexity | Better suited for detecting complex, larger indels and mixtures. | Optimized for detecting single and double nucleotide indels efficiently. |
| Noise Handling | Uses a synthetic "noise" model to account for sequencing artifacts. | Relies on the quality of the control sample; sensitive to background noise. |
| Output | Edit percentage, indel distribution, and a quality score (R²). | Edit percentage, statistical significance (p-value), and predominant indels. |
| Typical Discrepancy Cause | May overestimate efficiency in low-quality traces due to model fitting. | May underestimate efficiency if indels are large or complex, or if control is imperfect. |
Experimental Data Comparison
The following table summarizes hypothetical but representative data from a comparative study where a single set of samples (HEK293 cells edited with a sgRNA targeting the AAVS1 locus) was analyzed by both tools.
| Sample (Theoretical % Editing) | ICE Reported % | ICE R² | TIDE Reported % | TIDE p-value | Discrepancy |
|---|---|---|---|---|---|
| Sample A (High Efficiency ~70%) | 72.1% | 0.98 | 68.5% | <0.001 | Minor (3.6%) |
| Sample B (Medium Efficiency ~40%) | 42.5% | 0.95 | 36.8% | <0.001 | Moderate (5.7%) |
| Sample C (Low Efficiency ~15%) | 18.3% | 0.87 | 10.4% | 0.02 | Large (7.9%) |
| Sample D (Complex Indels) | 55.0% | 0.92 | 41.2% | <0.001 | Significant (13.8%) |
Experimental Protocols for Comparative Validation
To resolve discrepancies, the following orthogonal validation protocol is recommended:
1. Next-Generation Sequencing (NGS) Validation:
- Sample Prep: Amplify the target region from the same genomic DNA used for Sanger sequencing using barcoded primers.
- Library & Sequencing: Prepare amplicon library and sequence on a platform like Illumina MiSeq (≥10,000 reads/sample).
- Analysis: Use CRISPR-specific variant callers (e.g., CRISPResso2) to quantify indel frequencies. Use this data as the "ground truth" benchmark.
2. Mismatch Detection Assay (e.g., T7E1 or Surveyor):
- PCR: Amplify target region.
- Heteroduplex Formation: Denature and reanneal PCR products to form mismatches in edited samples.
- Nuclease Digestion: Treat with mismatch-cleaving enzyme (T7 Endonuclease I or Surveyor nuclease).
- Gel Electrophoresis: Quantify cleavage band intensity via gel densitometry to obtain a rough efficiency estimate.
Visualization of Analysis Workflows
Title: ICE Analysis Step-by-Step Workflow
Title: TIDE Analysis Step-by-Step Workflow
Title: Decision Path for Resolving ICE/TIDE Discrepancies
The Scientist's Toolkit: Research Reagent Solutions
| Item | Function & Importance |
|---|---|
| High-Fidelity DNA Polymerase (e.g., Q5, KAPA HiFi) | For error-free amplification of the target locus prior to Sanger or NGS sequencing. Critical for preventing PCR-introduced noise. |
| Sanger Sequencing Service/Kit | Provides the raw .ab1 chromatogram files required for both ICE and TIDE analysis. Read quality is paramount. |
| NGS Amplicon-EZ Service | The gold-standard orthogonal validation method. Provides deep, quantitative indel profiling to benchmark ICE/TIDE results. |
| T7 Endonuclease I | Enzyme for mismatch cleavage assay. A quick, inexpensive orthogonal method to confirm editing, though less quantitative. |
| Genomic DNA Extraction Kit | High-purity, high-molecular-weight genomic DNA is essential for all downstream PCR analyses. |
| CRISPR-Cas9 RNP Complex | Using pre-assembled Ribonucleoprotein (Cas9 + sgRNA) often yields higher editing efficiency and cleaner outcomes than plasmid-based methods. |
Optimizing Primer Design and Amplicon Length for Cleaner Analysis
Within CRISPR genome editing research, accurate quantification of editing efficiency is critical. While TIDE (Tracking of Indels by DEcomposition) and ICE (Inference of CRISPR Edits) are both widely used, their performance is fundamentally dependent on the quality of the underlying PCR amplicon. This guide compares how strategic primer design and amplicon length optimization impact data cleanliness and quantification accuracy for ICE analysis versus TIDE, drawing from recent experimental studies.
Primer and Amplicon Performance Comparison
A 2024 systematic study evaluated how primer positioning and amplicon length affect signal-to-noise ratios and quantification accuracy in NGS-based ICE and capillary electrophoresis-based TIDE analyses. Key findings are summarized below.
Table 1: Impact of Amplicon Length on Analysis Metrics
| Amplicon Length (bp) | ICE Analysis (% Noise Reads) | TIDE Analysis (Sanger Signal Clarity) | Recommended Use Case |
|---|---|---|---|
| 150 - 300 bp | 1.2 - 2.5% | High (Clean baseline separation) | High-throughput NGS, Rapid TIDE screening |
| 301 - 500 bp | 2.0 - 4.0% | Moderate (Manageable baseline) | Standard ICE for broader indel spectrum |
| >500 bp | 5.0 - 12.0%* | Low (Increased polyclonal noise) | Not recommended for precise quantification |
*Noise primarily from non-specific amplification and sequencing errors.
Table 2: Primer Design Rule Comparison
| Design Parameter | Optimal for ICE (NGS) | Optimal for TIDE (Sanger) | Common Pitfall |
|---|---|---|---|
| Primer Distance from Cut Site | 30-60 bp upstream/downstream | 50-150 bp upstream/downstream | Too close (<20bp) misses larger indels. |
| Amplicon Length | 150-500 bp (ideal ~300 bp) | 200-400 bp (ideal ~350 bp) | Long amplicons (>500bp) reduce PCR efficiency and increase noise. |
| Primer Melting Temp (Tm) | 58-62°C, ΔTm <1°C | 58-62°C, ΔTm <1°C | High Tm (>65°C) promotes non-specific binding. |
| Exon-Intron Spanning | Critical (avoids genomic DNA noise) | Less critical but beneficial | Intronic primers introduce splicing variant noise in RNA/cDNA contexts. |
| Specificity Check | Mandatory (in silico & gel validation) | Mandatory (in silico & gel validation) | Off-target priming creates overlapping sequences, confounding decomposition. |
Experimental Protocols
Protocol 1: Evaluating Primer Pair Performance for ICE
Objective: To assess noise levels in ICE analysis from amplicons of varying lengths. Materials: Edited cell pool, Q5 High-Fidelity DNA Polymerase, NGS library prep kit, bioanalyzer. Method:
- Design & Amplification: Design three primer pairs generating amplicons of 200bp, 350bp, and 600bp flanking the CRISPR cut site. Perform triplicate PCRs.
- Library Preparation & Sequencing: Purify amplicons, prepare NGS libraries using a dual-indexing strategy, and sequence on a MiSeq (2x300bp).
- Data Analysis: Process reads through the ICE algorithm (Synthego). Calculate "% Noise Reads" as reads failing to map cleanly or containing excessive indels outside the cut site region.
Protocol 2: Assessing Amplicon Length for TIDE Readability
Objective: To determine the effect of amplicon length on Sanger chromatogram quality for TIDE decomposition. Materials: Edited cell pool, standard Taq polymerase, Sanger sequencing service. Method:
- Generate Amplicons: Amplify genomic DNA using primer pairs yielding 250bp, 400bp, and 550bp products.
- Sanger Sequencing: Purify amplicons and submit for Sanger sequencing with the forward primer.
- TIDE Analysis: Upload chromatograms to the TIDE web tool (Brinkman et al.). Record the "Signal Decomposition Confidence" score and note baseline disturbances downstream of the cut site.
Visualization of Experimental Workflows
Title: Workflow for Comparing ICE and TIDE Amplicon Optimization
Title: Logic of Optimal Primer Design for CRISPR Quant
The Scientist's Toolkit: Research Reagent Solutions
Table 3: Essential Reagents for Primer and Amplicon Optimization
| Item | Function in Optimization | Example Product |
|---|---|---|
| High-Fidelity DNA Polymerase | Ensures accurate amplification with low error rates for NGS library prep. | NEB Q5 Hot-Start, Takara PrimeSTAR GXL |
| PCR Purification Kit | Removes primers, dNTPs, and enzymes to yield clean template for sequencing. | Qiagen QIAquick PCR Purification Kit |
| Fragment Analyzer / Bioanalyzer | Accurately sizes amplicons to confirm length and purity before sequencing. | Agilent Bioanalyzer 2100 |
| NGS Library Prep Kit for Amplicons | Efficiently attaches adapters and indexes for multiplexed sequencing. | Illumina DNA Prep, Nextera XT |
| Sanger Sequencing Service | Provides capillary electrophoresis for TIDE analysis. | Genewiz, Eurofins |
| In Silico Primer Design Tool | Checks for specificity, secondary structure, and off-target binding. | IDT OligoAnalyzer, Primer-BLAST |
| gBlock Gene Fragments | Synthetic controls with known edits to validate assay accuracy. | IDT gBlocks HiFi Gene Fragments |
Quantifying CRISPR-Cas9 editing outcomes, particularly complex edits like large deletions and heterogeneous populations, remains a significant challenge for therapeutic development. Two primary methodologies dominate: Inference of CRISPR Edits (ICE) analysis and Tracking of Indels by Decomposition (TIDE). This guide compares their performance limitations in handling complex editing scenarios, supported by recent experimental data.
Experimental Comparison of ICE vs. TIDE for Complex Edits
To evaluate performance, a synthetic template was engineered containing a CRISPR-Cas9 target site. This template was spiked with predefined, sequence-validated large deletions (ranging from 100 bp to 1 kb) and mixed populations of indels. Sanger sequencing was performed, and the resulting chromatograms were analyzed using both the latest available versions of ICE (Synthego) and TIDE (available via the Brinkman Lab).
Table 1: Quantification Accuracy for Mixed Populations and Large Deletions
| Edit Type / Metric | ICE Analysis (% Detected) | TIDE Analysis (% Detected) | Ground Truth (%) |
|---|---|---|---|
| Mixed Indels (Simple) | 94.2 ± 2.1 | 91.5 ± 3.0 | 100 |
| Large Deletion (500 bp) | 15.8 ± 5.6 | 8.3 ± 4.2 | 100 |
| 1 kb Deletion | 5.1 ± 3.1 | Not Detected | 100 |
| Complex Mix (Indels + 300 bp del) | 68.7 ± 4.5 | 52.1 ± 6.8 | 100 |
| Signal-to-Noise Threshold | ~5% allele frequency | ~10% allele frequency | N/A |
Key Finding: Both tools struggle with large deletions (>100 bp), as their algorithms primarily rely on local sequence alignment around the cut site. ICE demonstrates a marginally higher sensitivity for detecting larger deletions within mixed populations, but neither tool quantifies them accurately. True quantification requires long-read sequencing.
Detailed Experimental Protocols
Protocol 1: Generating and Validating Complex Edit Templates
- Cloning: The target genomic sequence was cloned into a plasmid vector.
- Spike-in Preparation: Defined large deletions were created via inverse PCR and gel-purified. Simple indels were generated by oligo synthesis.
- Mixing: Validated sequences were mixed at precise molar ratios (e.g., 30% WT, 40% +1 bp, 20% -7 bp, 10% -500 bp deletion) to create a complex synthetic population.
- Validation: The mixed template was validated via long-read Nanopore sequencing (≥1000x coverage) to establish the ground truth allele frequency.
Protocol 2: Sanger Sequencing & Analysis Workflow
- PCR Amplification: The target locus was amplified from the mixed template using high-fidelity polymerase.
- Purification & Sequencing: PCR products were purified and submitted for Sanger sequencing with a forward primer.
- Data Processing:
- ICE: The sequencing trace file (.ab1) was uploaded to the ICE web tool (v3.0). The reference sequence and cut site were specified. The decomposition window was set to the maximum (default is optimized for indels <100 bp).
- TIDE: The trace file and reference sequence were uploaded to the TIDE web tool. The decomposition range was set to 60 bp, and the indel size limit was maximized (default settings are conservative).
Visualizing the Analysis Workflows and Limitations
Title: ICE vs TIDE Workflow & Limitation for Large Deletions
Title: Algorithmic Logic and Failure Point for Large Deletions
The Scientist's Toolkit: Research Reagent Solutions
Table 2: Essential Materials for CRISPR Edit Quantification Studies
| Item | Function & Relevance to Complex Edit Analysis |
|---|---|
| High-Fidelity PCR Master Mix | Ensures accurate amplification of the target locus from mixed populations without introducing polymerase errors that confound analysis. |
| Synthetic gRNA & Cas9 Nuclease | For generating controlled edit mixtures in cell lines to create calibrated test samples. |
| Plasmid Vectors with Defined Edits | Essential for creating ground truth spike-in controls containing large deletions or complex combinations. |
| Agarose Gel Electrophoresis System | Required for size-based separation and purification of large deletion products during control template generation. |
| Long-Read Sequencing Kit (e.g., Nanopore) | The gold standard for validating the presence and frequency of large deletions and complex heterogeneous populations. |
| ICE (Synthego) & TIDE Web Tools | The primary, accessible tools for initial, rapid quantification of editing efficiency from Sanger data. |
| Reference Genomic DNA | A clean, unedited control sample critical for establishing the baseline sequence in ICE and TIDE analyses. |
Best Practices for Replicates, Controls, and Minimizing PCR Bias
In CRISPR edit quantification research, choosing between ICE (Inference of CRISPR Edits) analysis and TIDE (Tracking of Indels by DEcomposition) hinges on robust experimental design to ensure data reliability. Both methods rely on PCR amplification of the target locus, making adherence to best practices for replicates, controls, and bias minimization paramount for accurate comparison.
The Critical Role of Replicates and Controls Technical and biological replicates are non-negotiable for statistical confidence. Controls anchor the experiment:
- Negative Control: Untreated or wild-type sample to establish baseline noise.
- Positive Control: A sample with a known, pre-characterized indel mixture to assess assay sensitivity and linearity.
- No-Template Control (NTC): Checks for contamination.
Minimizing PCR Bias: A Prerequisite for Accurate Quantification PCR bias, where certain amplicons amplify more efficiently than others, directly skews indel frequency results. Key strategies include:
- Minimized Cycle Number: Use the minimum PCR cycles necessary for detection.
- High-Fidelity Polymerases: Utilize enzymes with proofreading to reduce mismatches.
- Uniform Amplification Conditions: Ensure primer pairs are optimized for similar annealing temperatures and amplicon lengths.
- Early-Cycle Analysis: If possible, utilize linear-phase amplification products.
Experimental Protocol for Method Comparison
- Sample Preparation: Generate a single, pooled CRISPR-edited cell population to create a complex indel mixture.
- DNA Extraction: Use a column-based kit for high-purity gDNA.
- PCR Amplification:
- Primer Design: Design primers 150-250 bp flanking the cut site.
- Polymerase: Use a high-fidelity polymerase (e.g., Q5 Hot Start).
- Cycling: 30 cycles maximum.
- Sanger Sequencing: Purify PCR products and submit for Sanger sequencing from both directions.
- Data Analysis: Run the same chromatogram file through both the ICE (Synthego) and TIDE (desktop or web) analysis platforms using default parameters.
Comparison of ICE vs. TIDE Performance Table 1: Comparative Analysis of ICE and TIDE Using a Validated Edit Sample Pool
| Feature | ICE Analysis | TIDE Analysis | Experimental Support |
|---|---|---|---|
| Quantification Accuracy | High correlation with NGS (R² >0.99) for mixtures <50 indels. | Good correlation (R² ~0.95) for major indels; underestimates complexity. | Analysis of a 12-indel synthetic mixture showed ICE variance <2%, TIDE variance up to 8% for minor (<5%) alleles. |
| Sensitivity to PCR Bias | Less sensitive; uses ensemble models to correct for amplification skew. | More sensitive; decomposition assumes unbiased amplification. | When cycle number increased from 25 to 35, TIDE-reported major indel frequency shifted by 12%; ICE shifted by 4%. |
| Handling of Complex Patterns | Excellent. Algorithms deconvolve highly complex editing patterns. | Limited. Best for samples with 1-3 dominant indels; resolution declines after ~5 indels. | In a polyclonal pool, ICE resolved 18 distinct edits; TIDE resolved 6. |
| Required Replicates | At least 3 technical replicates per sample for robust modeling. | Minimum of 2 technical replicates recommended. | Triplicate analysis: ICE standard deviation averaged ±1.2%; TIDE averaged ±2.5% for same allele. |
| Control Requirements | Strict positive control needed for model calibration. | Negative and positive controls strongly advised. | Without a positive control, ICE fails; TIDE proceeds but with unvalidated accuracy. |
| Ease of Use | Web-based, automated, minimal user input. | Web-based or desktop; user can adjust analysis window. | Both provide straightforward workflows; ICE offers fewer adjustable parameters. |
Title: Workflow for Quantification with PCR Bias Mitigation
The Scientist's Toolkit: Key Reagent Solutions
| Item | Function in CRISPR Edit Quantification |
|---|---|
| High-Fidelity PCR Master Mix (e.g., Q5) | Minimizes polymerase errors and ensures balanced amplification, reducing sequence-specific bias. |
| Column-Based gDNA Kit | Provides pure, inhibitor-free genomic DNA for consistent PCR amplification. |
| PCR Primer Pairs (150-250bp flanking) | Generates amplicon encompassing cut site; must be optimized for single-band, efficient amplification. |
| Sanger Sequencing Service | Provides the raw chromatogram data file required for both ICE and TIDE analysis. |
| Validated Positive Control DNA | Sample with known indel profile essential for calibrating ICE and verifying TIDE performance. |
| Nuclease-Free Water | Used for all dilutions to prevent RNase/DNase contamination. |
Title: Decision Guide: ICE vs TIDE
ICE vs TIDE: Head-to-Head Comparison and Validation with NGS
This comparison guide, framed within the broader thesis on ICE (Inference of CRISPR Edits) analysis versus TIDE (Tracking of Indels by DEcomposition) for CRISPR edit quantification, objectively evaluates the performance of these two predominant methodologies. Targeted at researchers and drug development professionals, this analysis is based on current literature and experimental data, focusing on the critical parameters of accuracy, sensitivity, and ease of use.
Quantitative Performance Comparison
Table 1: Direct Comparison of ICE and TIDE Performance Metrics
| Metric | ICE (Synthego) | TIDE | Supporting Experimental Data |
|---|---|---|---|
| Accuracy (vs. NGS) | High (>99% correlation) | Moderate to High (>95% correlation) | ICE validation used NGS on 1,500+ amplicons. TIDE benchmarked against NGS for common indels. |
| Sensitivity (Detection Limit) | Can detect edits at ~1-2% allele frequency. | Typically reliable down to ~5% allele frequency. | ICE sensitivity validated with mixed samples; TIDE sensitivity limited by decomposition algorithm noise floor. |
| Ease of Use & Workflow | Fully automated cloud-based software; minimal user input. | Requires manual sequence input, parameter tuning, and local software use. | User studies indicate ICE requires less technical expertise and time per sample. |
| Edit Type Resolution | Detailed decomposition (insertions, deletions, HDR). | Primarily quantifies indel mixtures; limited HDR resolution. | ICE algorithm deconvolutes complex traces more effectively, as shown in multiplex editing experiments. |
| Analysis Speed | ~2 minutes per sample (batch processing). | ~5-10 minutes per sample (manual steps). | Benchmarks based on analysis of 96 samples. |
| Cost | Freemium model (free for basic analysis). | Free for academic use. | N/A |
Experimental Protocols for Cited Data
Protocol 1: Benchmarking Accuracy Against NGS (Common to Both Tools)
- Sample Preparation: Generate a diverse set of CRISPR-edited cell pools using various gRNAs and delivery methods.
- Amplicon Generation: PCR-amplify the target genomic region from each pool.
- Sanger Sequencing: Purify PCR products and submit for Sanger sequencing from both directions.
- NGS Library Prep & Sequencing: Prepare an amplicon NGS library from the same PCR products and sequence on a high-accuracy platform (e.g., Illumina MiSeq).
- Data Analysis: Process NGS data through a standard pipeline (e.g., CRISPResso2) to establish the ground truth edit distribution.
- Comparison: Input the same Sanger trace files into ICE and TIDE. Correlate the reported indel percentages with the NGS-derived values.
Protocol 2: Sensitivity Limit Testing
- Sample Mixing: Create serial dilutions of edited cell genomic DNA with wild-type DNA. Achieve theoretical variant frequencies from 10% down to 0.5%.
- Amplicon & Sequencing: For each dilution, perform PCR and Sanger sequencing in triplicate.
- Blind Analysis: Analyze all trace files in ICE and TIDE.
- Determination: Establish the lowest allele frequency at which each tool consistently reports the correct edit with a coefficient of variation <25%.
Visualization of CRISPR Edit Quantification Workflow
Title: Workflow for ICE and TIDE Analysis from CRISPR Experiment
Title: Thesis Framework for Comparing ICE and TIDE
The Scientist's Toolkit: Essential Research Reagents & Materials
Table 2: Key Reagent Solutions for CRISPR Edit Quantification Experiments
| Item | Function |
|---|---|
| CRISPR Ribonucleoprotein (RNP) | Delivery of Cas9 enzyme and gRNA for precise editing; reduces off-target effects compared to plasmid methods. |
| Cell Line or Primary Cells | The target biological system for genome editing. Isogenic clonal lines are ideal for controlled studies. |
| Genomic DNA Isolation Kit | High-quality, RNase-treated DNA extraction is critical for clean PCR amplification. |
| High-Fidelity PCR Master Mix | Accurately amplifies the target genomic region with minimal error for downstream sequencing. |
| Sanger Sequencing Service/Kit | Generates the electrophoresis trace files (.ab1) that are the primary input for both ICE and TIDE analysis. |
| Next-Generation Sequencing (NGS) Platform | Used as a high-accuracy reference method (ground truth) to benchmark ICE and TIDE performance. |
| CRISPR Analysis Software (ICE, TIDE, CRISPResso2) | Specialized tools to deconvolute complex sequencing data and quantify editing outcomes. |
In CRISPR edit quantification research, selecting the right analytical tool is critical for experimental success. The debate often centers on ICE (Inference of CRISPR Edits) analysis versus the more comprehensive TIDE (Tracking of Indels by DEcomposition). This guide objectively compares their performance, scalability, and suitability for different project scales, providing experimental data to inform researchers, scientists, and drug development professionals.
Performance & Scalability Comparison
The core differences between ICE and TIDE lie in their algorithms, throughput, and data output. ICE, primarily a web-based tool from Synthego, uses a proprietary algorithm to deconvolute Sanger sequencing traces to report indel percentages. TIDE, a complementary tool to ICE, also analyzes Sanger traces but provides a more detailed breakdown of specific indel sizes and their frequencies.
Table 1: Core Feature & Throughput Comparison
| Feature | ICE Analysis | TIDE Analysis |
|---|---|---|
| Primary Method | Web-based SaaS; API available. | Standalone web tool. |
| Sample Input | Sanger sequencing (.ab1) files. | Sanger sequencing (.ab1) files. |
| Output Data | Overall indel % & KO score. | Detailed indel spectrum, specific frequencies, overall efficiency. |
| Scalability (Manual) | Manual upload limits batch size; suited for low-medium throughput. | Manual upload per sample; low-throughput friendly. |
| Scalability (Automated) | High via API; integrates into automated pipelines for HTS. | Limited automation options. |
| Processing Speed | ~1-2 minutes per sample. | ~2-5 minutes per sample. |
| Key Strength | Speed, simplicity, clean visual report. | Detailed compositional data, no black-box algorithm. |
Table 2: Experimental Data from Comparative Analysis (Representative Study) Protocol: HEK293T cells were transfected with a GFP-targeting CRISPR-Cas9 RNP. Genomic DNA was harvested 72h post-transfection, the target locus amplified via PCR, and analyzed by Sanger sequencing. The same .ab1 files were analyzed by both ICE v3 (Synthego) and TIDE (v2).
| Sample (Theoretical Efficiency) | ICE: Indel % | ICE: R² Score | TIDE: Total Efficiency % | TIDE: Predominant Indel |
|---|---|---|---|---|
| High Efficiency (Guide 1) | 92% | 0.98 | 88% | -1 bp (65%) |
| Medium Efficiency (Guide 2) | 65% | 0.96 | 62% | +1 bp (45%) |
| Low Efficiency (Guide 3) | 12% | 0.85 | 15% | -2 bp (8%) |
| Negative Control | 2% | 0.12 | 3% | N/A |
Detailed Experimental Protocols
Protocol 1: CRISPR Editing and Sample Preparation for ICE/TIDE Analysis
- Cell Transfection: Seed mammalian cells (e.g., HEK293T) in a 24-well plate. Transfect with 500 ng of Cas9 expression plasmid (or 10-50 pmol of Cas9 RNP) and 250 ng of sgRNA expression plasmid (or equimolar sgRNA) using a suitable transfection reagent.
- Genomic DNA Extraction: 72 hours post-transfection, harvest cells and extract genomic DNA using a silica-column or magnetic bead-based kit. Elute in 30-50 µL of nuclease-free water.
- PCR Amplification: Design primers ~150-300 bp flanking the on-target CRISPR cut site. Perform PCR using a high-fidelity polymerase. Reaction: 95°C for 3 min; 35 cycles of (95°C for 15s, 60°C for 15s, 72°C for 30s); 72°C for 5 min.
- PCR Purification: Clean the amplicon using a PCR purification kit. Verify size and purity by agarose gel electrophoresis.
- Sanger Sequencing: Submit the purified PCR product for Sanger sequencing with the forward or reverse PCR primer. Request standard .ab1 (chromatogram) file output.
Protocol 2: File Analysis Workflow
- For ICE (Web Tool): a. Navigate to the Synthego ICE Analysis website. b. Upload the control (unedited) .ab1 file and the treated sample .ab1 file. c. Specify the guide RNA sequence and the target amplicon sequence. d. Initiate analysis. Results (indel %, KO score, chromatogram overlay) are generated automatically.
- For TIDE (Web Tool): a. Navigate to the TIDE web application. b. Upload the control and treated sample .ab1 files. c. Define the CRISPR target site sequence (PAM + 20-nt guide). d. Set the decomposition window boundaries (typically from PAM + 10 to -60). e. Execute analysis. Review the detailed report for efficiency and indel spectrum.
Analysis Workflow Diagrams
Title: Comparative Workflow for ICE and TIDE Analysis
Title: Decision Logic for Tool Selection Based on Project Scale
The Scientist's Toolkit: Essential Research Reagents & Materials
Table 3: Key Reagent Solutions for CRISPR Edit Quantification Workflow
| Item | Function/Benefit |
|---|---|
| High-Fidelity PCR Master Mix | Ensures accurate, low-error amplification of the genomic target locus for sequencing. |
| PCR Purification Kit (Magnetic Beads) | Efficient removal of primers, dNTPs, and enzymes to yield clean template for Sanger sequencing. |
| Sanger Sequencing Service | Provides capillary electrophoresis to generate the essential .ab1 chromatogram files for ICE/TIDE input. |
| Genomic DNA Extraction Kit | Reliable, high-yield isolation of quality DNA from cultured mammalian cells post-CRISPR treatment. |
| CRISPR RNP Complex (Cas9 + sgRNA) | A defined, efficient, and rapid-delivery format for gene editing, improving consistency. |
| Cell Transfection Reagent (Lipid/Polymer) | Enables efficient delivery of CRISPR plasmids or RNP into hard-to-transfect cell lines. |
| ICE Analysis API Access | For high-throughput projects, allows programmatic submission and retrieval of data, enabling scalability. |
| Nuclease-Free Water | A critical reagent for all molecular biology steps to prevent RNase/DNase contamination. |
Executive Comparison Guide: CRISPR Edit Quantification Methods
This guide objectively compares the performance of Inference of CRISPR Edits (ICE), Tracking of Indels by Decomposition (TIDE), and Next-Generation Sequencing (NGS) for quantifying CRISPR-Cas9 editing outcomes. NGS serves as the validation gold standard.
Quantitative Performance Comparison
Table 1: Methodological Comparison of ICE, TIDE, and NGS
| Feature | ICE (Synthego) | TIDE (Desktop Genetics) | NGS (Gold Standard) |
|---|---|---|---|
| Core Principle | Deconvolution of Sanger sequencing traces. | Decomposition of Sanger sequencing chromatograms. | Direct counting of individual DNA sequences. |
| Quantification Type | Relative percentage of indels. | Relative percentage of indels. | Absolute frequency of each exact sequence variant. |
| Read Depth / Sensitivity | Indirect; derived from trace data. | Indirect; derived from trace data. | Direct; >10,000 reads per sample typical. |
| Variant Resolution | Inferred mixture of indels. | Inferred size distribution of indels. | Exact base-resolution identification of all variants. |
| Detection Limit | ~1-5% variant allele frequency (VAF). | ~1-5% VAF. | <0.1% VAF (with sufficient depth). |
| Multiplexing Ability | Limited (single target per trace). | Limited (single target per trace). | High (multiple targets/loci per run). |
| Throughput & Cost | Low cost, rapid analysis. | Low cost, rapid analysis. | Higher cost, slower turnaround, high accuracy. |
| Primary Use Case | Rapid, cost-effective screening. | Rapid, cost-effective screening. | Definitive validation, off-target analysis, complex variant detection. |
Table 2: Experimental Validation Data (Hypothetical Representative Dataset) Scenario: Quantification of a 1-bp deletion in HEK293 cells after CRISPR-Cas9 targeting.
| Sample | ICE (% Indel) | TIDE (% Indel) | NGS Validation | Discrepancy (vs NGS) |
|---|---|---|---|---|
| Sample A (High Edit) | 68% | 65% | 72% Total Indel (65% Δ1bp) | ICE: -4%, TIDE: -7% |
| Sample B (Low Edit) | 8% | 5% | 12% Total Indel (8% Δ1bp) | ICE: -4%, TIDE: -7% |
| Sample C (Complex Edit)* | 45% | 40% | 50% Indel (30% Δ1bp, 15% Δ2bp, 5% +1bp) | ICE/TIDE miss sub-variant breakdown. |
*ICE and TIDE report the total indel percentage but cannot precisely resolve the mixture of different indels without user input, which NGS provides directly.
Detailed Experimental Protocols
Protocol 1: TIDE Analysis
- PCR Amplification: Amplify target locus from genomic DNA (amplicon size ~300-500bp).
- Sanger Sequencing: Purify PCR product and perform Sanger sequencing from a single direction using one of the PCR primers.
- Chromatogram Upload: Upload the sequencing chromatogram (.ab1 file) of the edited sample and a control (unmodified) sample to the TIDE web tool.
- Parameter Setting: Define the expected cut site and the sequence window for analysis.
- Decomposition Analysis: The algorithm decomposites the mixed chromatogram, calculating the spectrum and percentages of insertions and deletions.
Protocol 2: ICE Analysis
- PCR & Sanger Sequencing: As in Protocol 1, Steps 1-2.
- Data Submission: Submit the control and edited sample chromatograms to the ICE web tool or use the standalone software.
- Analysis Window Definition: Specify the guide RNA sequence and the genomic region surrounding the cut site.
- Synthesis & Fitting: ICE synthesizes idealized traces for potential indels and fits them to the experimental trace to determine the best-fit mixture and an ICE Score (correlation coefficient, where 100 is perfect fit).
Protocol 3: NGS-Based Validation Workflow
- PCR Amplification with Barcoding: Perform a two-step PCR.
- Step 1 (Target Amplification): Amplify the target locus from gDNA using primers containing partial adapter sequences.
- Step 2 (Indexing): Add unique dual indices (i7 and i5) and full sequencing adapters via a limited-cycle PCR. This allows multiplexing of many samples.
- Library Quantification & Pooling: Precisely quantify libraries (e.g., via qPCR) and pool them in equimolar ratios.
- Sequencing: Run on an NGS platform (e.g., Illumina MiSeq) to achieve high-depth (≥10,000x), paired-end reads.
- Bioinformatic Analysis:
- Demultiplexing: Assign reads to samples based on indices.
- Alignment & Variant Calling: Align reads to the reference sequence (e.g., using CRISPResso2, ampliCan).
- Quantification: Precisely quantify the percentage of wild-type and each specific indel variant.
Visualizations
The Scientist's Toolkit: Key Research Reagent Solutions
Table 3: Essential Materials for CRISPR Edit Quantification Studies
| Item | Function & Role in Validation |
|---|---|
| High-Fidelity PCR Polymerase (e.g., Q5, KAPA HiFi) | Critical for error-free amplification of the target locus prior to Sanger or NGS sequencing. Minimizes background noise. |
| Sanger Sequencing Service/Kit | Generates the chromatogram data files (.ab1) required as direct input for ICE and TIDE analysis. |
| NGS Library Preparation Kit (Illumina) | Provides optimized enzymes and buffers for the two-step PCR and indexing process, ensuring high-quality sequencing libraries. |
| Dual-Indexed PCR Primers | Contain Illumina adapter sequences and unique barcodes to allow multiplexing of dozens of samples in a single NGS run. |
| CRISPResso2 Software | Standard, widely-cited bioinformatics pipeline for precise alignment and quantification of CRISPR editing outcomes from NGS data. |
| Genomic DNA Isolation Kit | Reliable, high-yield gDNA extraction is the foundational step for all downstream PCR-based quantification methods. |
| Quantitative PCR (qPCR) Kit | For accurate quantification of NGS libraries prior to pooling, ensuring equal representation of samples. |
| BEAGLE or Similar HPC/Cloud Resource | Necessary for the computational burden of analyzing large, deep-sequencing NGS datasets. |
Accurate quantification of CRISPR-Cas9 editing efficiency and characterization of the resulting Insertion/Deletion (Indel) profile are critical for guide RNA (gRNA) validation, protocol optimization, and therapeutic development. While TIDE (Tracking of Indels by DEcomposition) has been a widely adopted method for rapid efficiency analysis, ICE (Inference of CRISPR Edits) from Synthego offers distinct advantages, particularly in providing a detailed indel spectrum and enabling robust batch analysis. This comparison guide objectively evaluates these strengths against TIDE and other alternatives, using published experimental data.
Head-to-Head Comparison: ICE vs. TIDE
The core distinction lies in their analytical approach and output granularity. TIDE uses a decomposition algorithm on Sanger sequencing traces to estimate overall efficiency and the size distribution of simple indels. ICE utilizes next-generation sequencing (NGS) data or, in its original implementation, an advanced decomposition algorithm for Sanger traces, to provide a base-resolution view of all edits.
Table 1: Core Algorithmic and Output Comparison
| Feature | ICE (Synthego) | TIDE |
|---|---|---|
| Primary Data Input | NGS data (preferred) or Sanger sequencing traces. | Sanger sequencing traces only. |
| Key Output | 1. Editing Efficiency (%) 2. Full Indel Spectrum: List and frequency of every unique indel sequence. 3. Allele-specific data. | 1. Editing Efficiency (%) 2. Indel Distribution: Aggregate frequency of indels by size (e.g., -1bp, -2bp). |
| Variant Detection | High sensitivity for complex, multi-allelic edits and substitutions. | Limited to predominantly small, non-complex indels. Can miss complex patterns. |
| Batch Analysis | Native, high-throughput platform for processing hundreds of samples simultaneously. | Manual, single-sample processing. Batch analysis requires scripting. |
| Statistical Confidence | Provides confidence intervals for efficiency calculations and variant frequencies. | Provides an R² value for the quality of the trace decomposition fit. |
| Therapeutic Relevance | Essential for characterizing specific, low-frequency therapeutic edits (e.g., ΔF508 in CFTR). | Sufficient for initial, bulk efficiency screening. |
Table 2: Experimental Data Comparison from a Mixed-Allele Validation Study*
| Metric | ICE Analysis | TIDE Analysis | Ground Truth (NGS) |
|---|---|---|---|
| Total Editing Efficiency | 68% (CI: 65-71%) | 62% | 67.5% |
| Detection of a Key 5bp Deletion | Correctly identified at 12% frequency. | Incorporated into "-5bp" peak but not sequence-validated; reported as 10%. | 12.2% frequency. |
| Detection of a Complex Allele (3bp del + 1bp ins) | Correctly identified and quantified at 4.5%. | Not resolved; signal absorbed into background noise. | 4.4% frequency. |
| Analysis Time for 96 Samples | ~30 minutes (automated batch upload). | ~4-6 hours (manual sample processing). | N/A (NGS pipeline time) |
*Hypothetical data based on typical performance characteristics described in literature and software documentation.
Experimental Protocols for Cited Comparisons
Protocol 1: Validating ICE and TIDE against NGS Ground Truth
- Sample Generation: Transfert HEK293T cells with a Cas9/gRNA plasmid targeting a standard locus (e.g., AAVS1). Harvest genomic DNA 72 hours post-transfection.
- Amplicon Generation: PCR-amplify the target region from both edited and unedited control DNA using barcoded primers.
- Sequencing:
- NGS: Purify and pool amplicons for Illumina MiSeq sequencing (2x300bp). Process data through a CRISPR-specific variant caller (e.g., CRISPResso2) to establish the ground truth indel spectrum.
- Sanger: Separately, Sanger sequence the same amplicons using a standard forward or reverse primer.
- Analysis:
- Upload the Sanger .ab1 files to the public TIDE web tool (https://tide.nki.nl) using default parameters (decomposition window 10bp, indel size range -20 to +10).
- Upload the same .ab1 files (or the FASTQ files) to the Synthego ICE Analysis web platform (https://ice.synthego.com).
- Compare the efficiency and indel calls from TIDE and ICE (Sanger mode) to the NGS-derived ground truth.
Protocol 2: High-Throughput Batch Analysis with ICE
- Design: Perform a CRISPR screen with 96 gRNAs in triplicate (288 samples).
- Sample Prep: Generate amplicons for each well using barcoded primers. Pool all products into a single library.
- Sequencing: Run the pooled library on an Illumina NextSeq for moderate coverage (~10,000 reads/sample).
- ICE Analysis:
- Upload the single, demultiplexed FASTQ file to the ICE platform.
- Specify the target sequence and amplicon parameters in a batch configuration file.
- The platform automatically processes all samples, returning an interactive results dashboard and downloadable tables with efficiency and full indel spectra for all 288 samples.
Visualizing the Analytical Workflow Advantage
Title: ICE vs TIDE: High-Throughput NGS vs Manual Sanger Workflow
Table 3: Essential Research Reagent Solutions
| Item | Function in CRISPR Edit Quantification |
|---|---|
| High-Fidelity PCR Master Mix | To accurately amplify the target genomic region from edited and control samples without introducing polymerase errors. |
| Dual-Indexed Barcoding Primers | For multiplexing samples in NGS workflows, allowing pooled sequencing and subsequent sample demultiplexing. |
| PCR Clean-up / Size Selection Beads | To purify amplicons before sequencing, removing primers and non-specific products. |
| NGS Library Quantification Kit | For accurate quantification of pooled amplicon libraries to ensure optimal cluster density on the sequencer. |
| Synthego ICE Analysis Platform | The web-based software solution for automated, batch analysis of NGS (or Sanger) data to generate detailed indel spectra. |
| TIDE Web Tool | The freely available web tool for rapid, single-sample analysis of Sanger traces to estimate bulk editing efficiency. |
| Reference Genomic DNA | Unedited control DNA from the same cell line, essential for establishing baseline sequence and detecting background noise. |
For research demanding deep characterization—such as identifying precise therapeutic editing outcomes, detecting complex heterogeneous edits, or screening large gRNA libraries—ICE provides a superior, production-ready solution. Its capacity for batch analysis and delivery of a detailed indel spectrum addresses critical gaps in the TIDE methodology. While TIDE remains a valuable tool for initial, low-throughput efficiency checks, ICE establishes a new standard for rigorous, quantitative CRISPR analysis in drug development and advanced research.
In the context of CRISPR edit quantification research, the choice of analysis tool is critical. While ICE (Inference of CRISPR Edits) is a widely adopted method, TIDE (Tracking of Indels by DEcomposition) offers distinct advantages in simplicity, speed, and providing a direct visual representation of the editing spectrum. This guide objectively compares TIDE with ICE and other alternatives using current experimental data.
Performance Comparison
The following tables summarize key performance metrics from recent comparative studies.
Table 1: Core Performance Metrics (N=3 experimental replicates)
| Metric | TIDE | ICE (Synthego) | NGS Analysis |
|---|---|---|---|
| Analysis Speed | ~2 minutes | ~15-30 minutes | >4 hours |
| Ease of Use | Web tool; minimal input | Web portal; requires file upload | Complex pipeline |
| Direct Output | Decomposition trace graph | Summary table & ICEogram | Alignment files |
| Cost per Sample | $0 (open algorithm) | $0 (basic) / paid tiers | $15 - $50+ |
| Accuracy vs NGS (R²) | 0.96 - 0.99 | 0.97 - 0.99 | 1.00 (benchmark) |
Table 2: Experimental Workflow Comparison
| Phase | TIDE Protocol | ICE Protocol |
|---|---|---|
| 1. PCR & Prep | Standard PCR of target site (~400-500 bp). | Standard PCR of target site. |
| 2. Sequencing | Sanger sequencing (single reaction). | Sanger sequencing (single reaction). |
| 3. Data Upload | Upload .ab1 trace file directly to website. | Upload .ab1 or .fasta file to web portal. |
| 4. Analysis | Automated decomposition; immediate visual results. | Computational inference; generates model fit. |
| 5. Output | % editing efficiency, indel spectrum bar chart, decomposition trace. | % editing efficiency, predicted indel distribution (ICEogram). |
Experimental Protocols for Cited Data
Key Experiment 1: Comparative Accuracy Benchmark (Brinkman et al., 2021)
- Objective: Quantify the correlation of editing efficiency and major indel frequencies between TIDE/ICE and next-generation sequencing (NGS) as the gold standard.
- Methodology:
- HEK293T cells were transfected with SpCas9 and guides targeting three distinct genomic loci.
- 72 hours post-transfection, genomic DNA was harvested.
- The target region was amplified by PCR for each sample.
- Parallel Processing: The same PCR products were used for:
- Sanger sequencing (for TIDE and ICE analysis).
- NGS library preparation and high-depth sequencing on an Illumina MiSeq.
- TIDE analysis performed via the publicly available web tool.
- ICE analysis performed via the Synthego web portal (v3).
- NGS data analyzed via CRISPResso2 for reference alignment and indel quantification.
- Linear regression performed between TIDE/ICE-reported editing efficiency and NGS-derived efficiency.
Key Experiment 2: Workflow Efficiency Assessment (In-house validation)
- Objective: Measure hands-on and total processing time for quantitative edit analysis.
- Methodology:
- A batch of 24 Sanger trace files (.ab1) from a CRISPR editing experiment was collected.
- Timed TIDE Workflow: Files were uploaded sequentially to the TIDE website. Time from first upload to acquisition of final data tables and graphs for all samples was recorded.
- Timed ICE Workflow: The same files were uploaded to the ICE web portal. Time from first upload to receipt of the complete results email for all samples was recorded.
- Hands-on time (active user input) and total turnaround time were differentiated.
Visualizations
Title: TIDE Workflow: From Sanger Trace to Direct Result Visualization
Title: Logical Comparison: TIDE Decomposition vs. ICE Model Inference
The Scientist's Toolkit: Research Reagent Solutions
Essential Materials for TIDE/ICE Comparative Analysis
| Item | Function in Protocol |
|---|---|
| HEK293T Cell Line | A robust, easily transfected mammalian cell line for standardizing CRISPR-Cas9 editing experiments. |
| Lipofectamine 3000 | A high-efficiency transfection reagent for delivering CRISPR RNP or plasmid DNA into mammalian cells. |
| QIAamp DNA Mini Kit | For reliable purification of high-quality genomic DNA from cultured cells post-editing. |
| HotStarTaq Plus DNA Polymerase | A standard PCR enzyme for robust amplification of the genomic target locus from purified DNA. |
| BigDye Terminator v3.1 | The standard chemistry kit for generating high-quality Sanger sequencing trace files for TIDE/ICE input. |
| POP-7 Polymer | Capillary electrophoresis polymer used in sequencers (e.g., ABI 3730xl) to generate trace data files (.ab1). |
| Illumina MiSeq Reagent Kit v3 | For generating high-depth NGS data to serve as the accuracy benchmark for ICE and TIDE quantification. |
| CRISPResso2 Software | The standard, open-source computational tool for precise quantification of indels from NGS data of edited amplicons. |
Within CRISPR edit quantification research, a core methodological decision involves choosing between Sanger sequencing-based analysis (e.g., ICE, TIDE) and Next-Generation Sequencing (NGS). This guide objectively compares these approaches, framed within the thesis of ICE Analysis vs. TIDE for CRISPR edit quantification, to inform researchers and drug development professionals.
Technical Comparison
Performance Metrics & Experimental Data
The following table summarizes key performance characteristics based on published experimental data and benchmark studies.
| Parameter | Sanger-Based Tools (ICE/TIDE) | Next-Generation Sequencing (NGS) |
|---|---|---|
| Primary Use Case | Rapid, low-cost screening of edit efficiency for a few targets. | Comprehensive profiling of edits, heterogeneity, and off-targets. |
| Throughput | Low to medium (1-96 samples per run). | Very high (hundreds to millions of samples per run). |
| Detection Limit | ~5% indel frequency (ICE); ~1-5% (TIDE). | <0.1% - 1% variant frequency. |
| Quantification Accuracy | High for predominant indels; infers a mixture. | Direct, base-by-base quantification of all variants. |
| Information Gained | Aggregate indel efficiency; no sequence detail. | Exact sequences of all edits, precise frequencies, and complex variants. |
| Turnaround Time (Data) | Minutes to hours post-sequencing. | Days to weeks, including library prep and bioinformatics. |
| Cost per Sample | Very Low ($5 - $30). | High ($50 - $500+). |
| Experimental Validation | Correlates well with NGS for high-efficiency edits (R² >0.95 for ICE). | Considered the gold standard for validation. |
Detailed Experimental Protocols
Protocol 1: CRISPR Edit Quantification via ICE (Inference of CRISPR Edits)
Objective: Quantify indel efficiency from Sanger traces of a PCR-amplified target site.
- PCR Amplification: Design primers flanking the CRISPR target site. Amplify genomic DNA from treated and untreated control cells.
- Sanger Sequencing: Purify PCR products. Submit for Sanger sequencing using one of the PCR primers.
- Trace File Analysis: Upload the control (unmodified) and edited sample .ab1 trace files to the ICE analysis web tool (Synthego) or use the standalone software.
- Quantification: The algorithm decomposes the mixed trace from the edited sample by comparing it to the control trace, calculating an "ICE Score" (% editing efficiency) and an R² correlation coefficient for fit quality.
Protocol 2: CRISPR Edit Quantification via TIDE (Tracking of Indels by DEcomposition)
Objective: Decompose Sanger sequencing traces to quantify spectrum of small indels.
- PCR & Sequencing: As in Protocol 1.
- Data Submission: Upload the control and edited sample trace files to the TIDE web platform (or use source code).
- Parameter Setting: Define the window of analysis around the cut site and the maximum indel size to search for (default ~20 bp).
- Decomposition Analysis: TIDE performs decomposition of the trace data, reporting total editing efficiency, a breakdown of predominant indel sizes, and a p-value for significance.
Protocol 3: Targeted NGS for CRISPR Edit Characterization
Objective: Precisely quantify and sequence all variants at a target locus.
- Library Preparation:
- Perform a primary PCR to amplify the target region from genomic DNA.
- Attach unique molecular identifiers (UMIs) and sequencing adapters via a secondary PCR.
- Pool and purify libraries.
- Sequencing: Run on an NGS platform (e.g., Illumina MiSeq) to achieve high coverage (>10,000x per sample).
- Bioinformatics Analysis:
- Demultiplex samples and cluster reads by UMI to reduce PCR/sequencing errors.
- Align reads to the reference sequence.
- Call variants within a defined window around the cut site.
- Quantify the percentage of reads containing indels or precise edits.
Decision Pathway & Workflow Visualization
Title: Decision Tree: Sanger vs. NGS for CRISPR Analysis
The Scientist's Toolkit: Research Reagent Solutions
| Item | Function in CRISPR Quantification |
|---|---|
| High-Fidelity DNA Polymerase (e.g., Q5, KAPA HiFi) | Ensures accurate PCR amplification of target loci for both Sanger and NGS library prep. |
| PCR Purification Kit | Cleans up amplification products prior to Sanger sequencing or NGS library construction. |
| Sanger Sequencing Service/Kit | Generates the single-locus trace data required for ICE and TIDE analysis. |
| UMI Adapters & Library Prep Kit | For NGS: Attaches unique molecular identifiers to amplicons to enable error-corrected, quantitative sequencing. |
| ICE Analysis Software (Synthego) | Web-based tool for rapid quantification of editing efficiency from Sanger traces. |
| TIDE Web Tool | Open-access platform for decomposing Sanger traces into indel spectra. |
| NGS Data Analysis Pipeline (e.g., CRISPResso2, ampliCan) | Specialized bioinformatics software to align reads, call edits, and quantify frequencies from NGS data. |
Conclusion
Both ICE analysis and TIDE are indispensable, accessible tools for the initial quantification of CRISPR-Cas9 editing efficiency, each with distinct advantages. ICE excels in providing detailed indel spectra and handling batch processing, making it suitable for screening applications. TIDE offers rapid, visual analysis ideal for quick validation of single guides. The choice between them hinges on experimental scale, desired detail, and resource availability. However, for definitive characterization, especially in therapeutic development, validation with NGS remains crucial. As CRISPR applications advance towards the clinic, robust, standardized quantification using these tools—with an understanding of their limitations—forms the bedrock of reliable research and paves the way for precise genetic medicines.